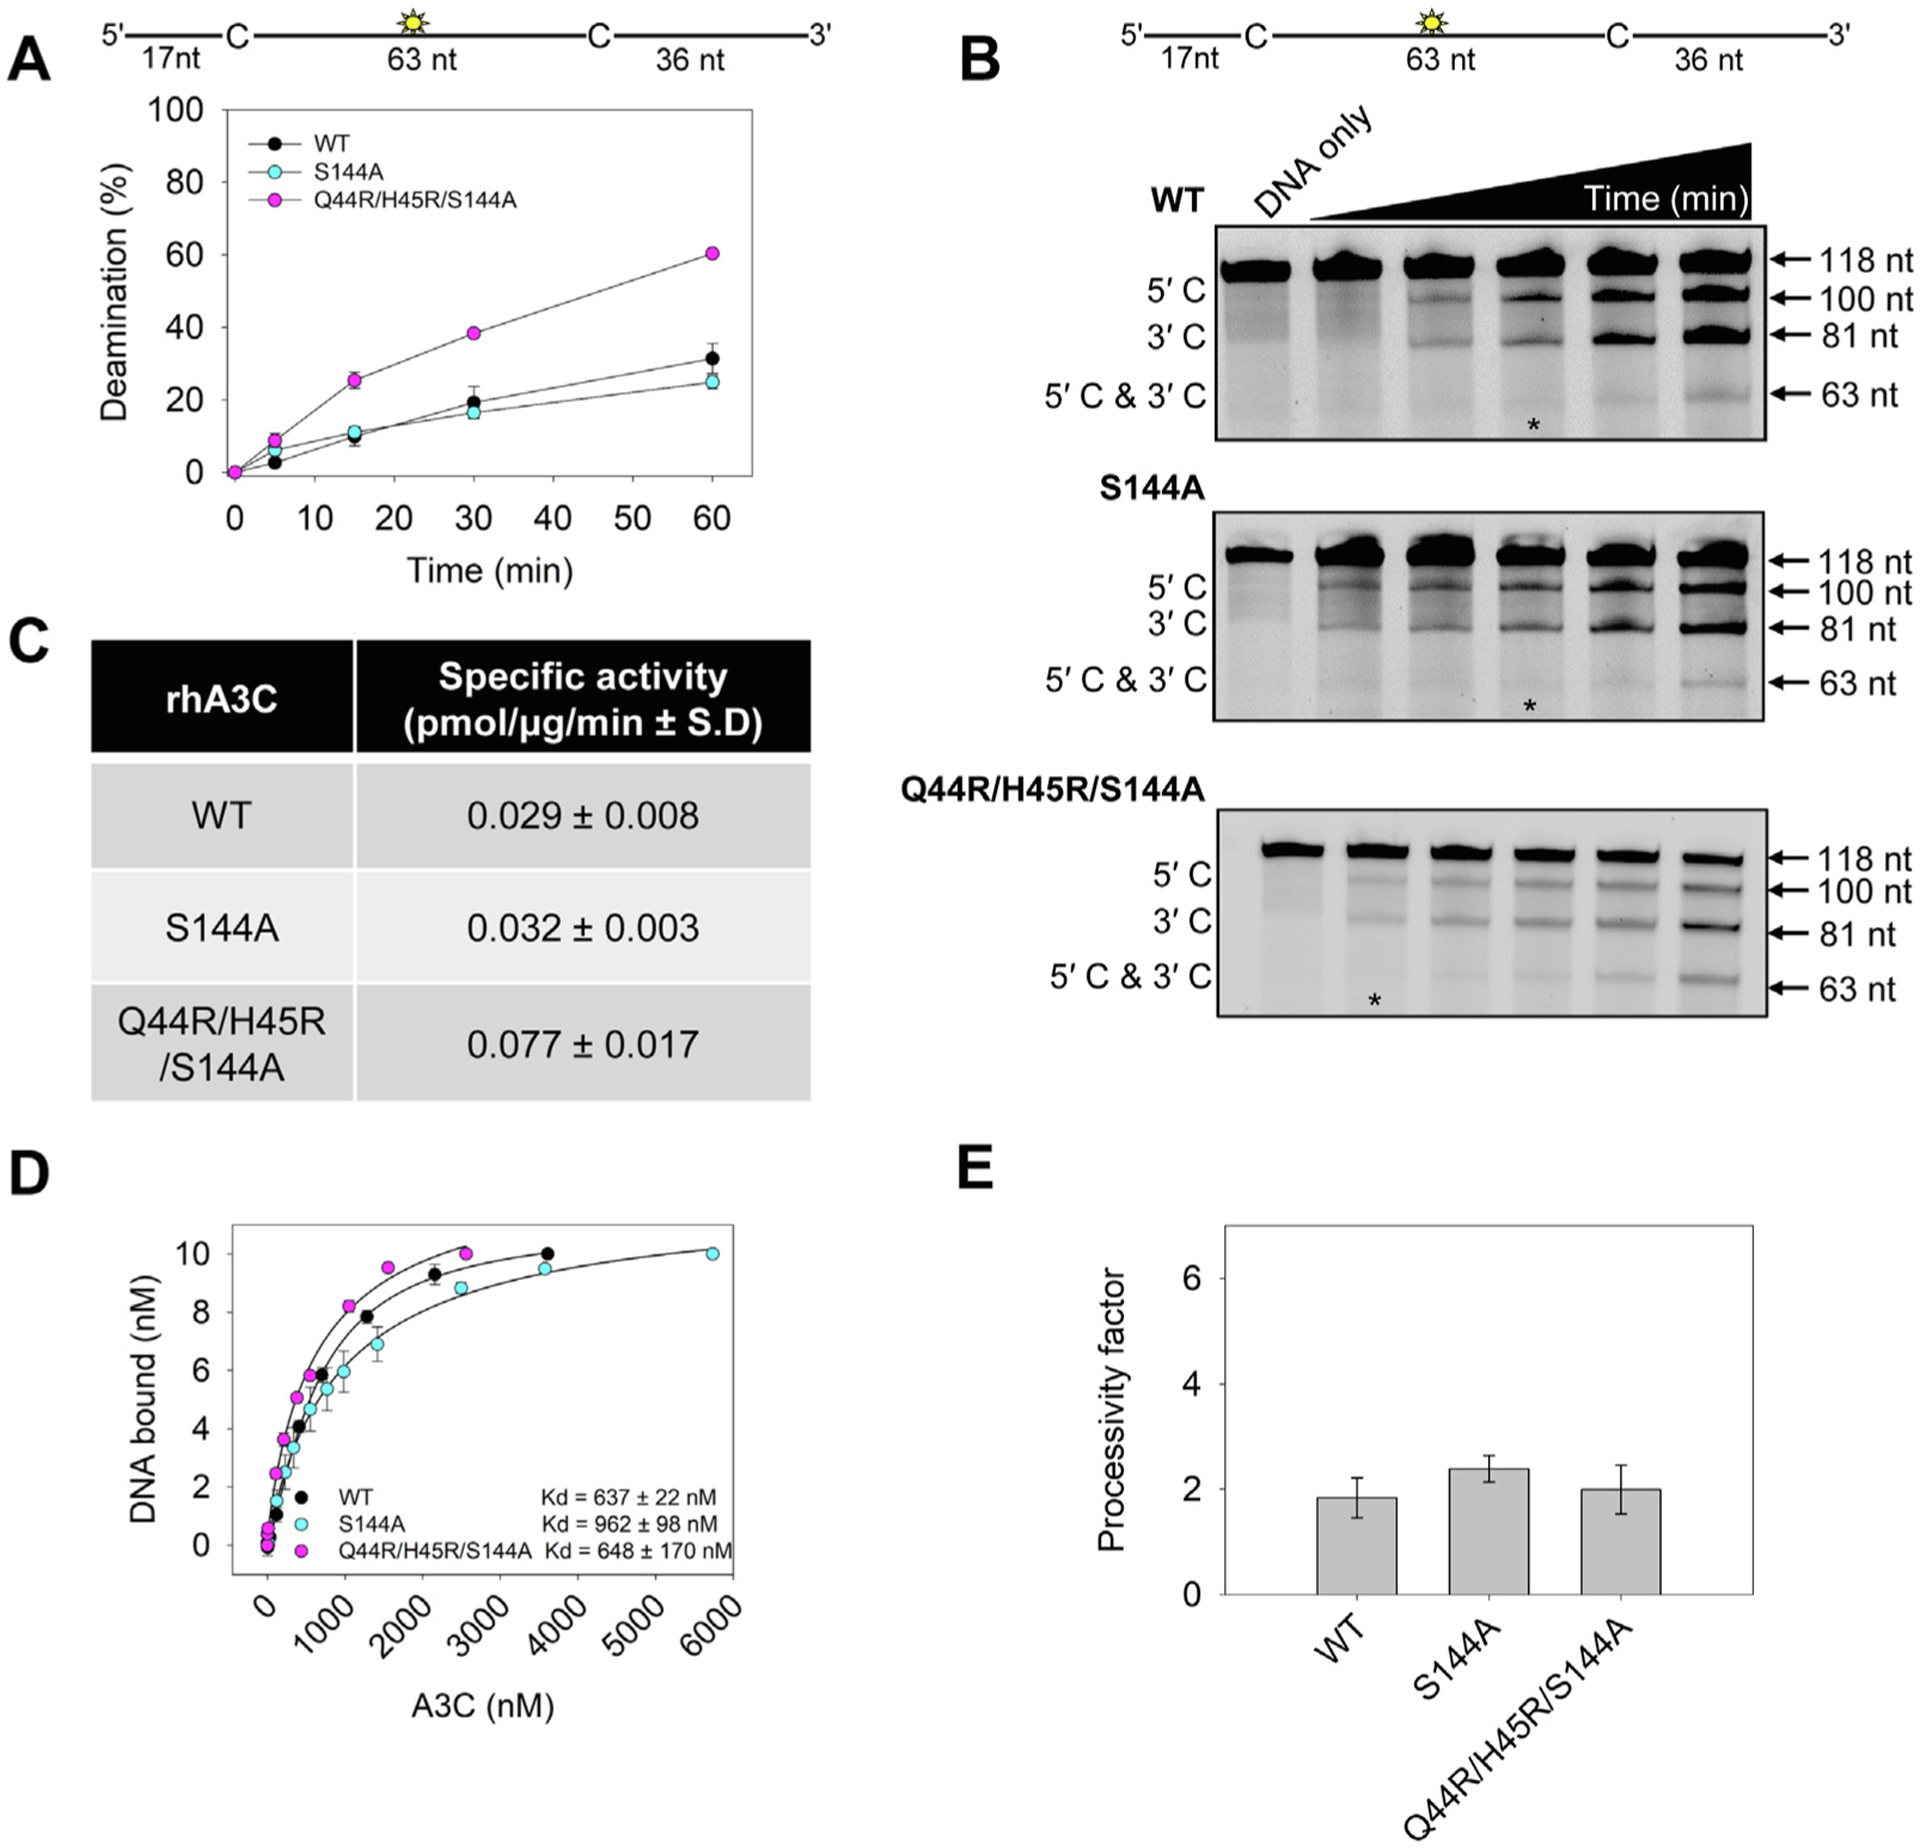
Figure 9. An S144A amino acid change in rhA3C increases deamination activity, but not processivity.

(A–B) Time course of rhA3C WT, S144A, and Q44R/H45R/S144A on a 118 nt fluorescently labeled ssDNA with two 5′TTC deamination motifs spaced 63 nt apart. Reactions were performed with 100 nM substrate DNA and 1000 nM rhA3C for the indicated amount of time (5–60 min). (B) Representative gel from three independent deamination assay experiments. Lanes with an asterisk were used for processivity calculations shown in panel (E). (C) Specific activity was calculated from the time course in (A) and showed increased activity if the rhA3C had the Q44R/H45R/S144A mutation. (D) The apparent Kd of rhA3C enzymes from a 118 nt fluorescently labeled ssDNA was analyzed by steady-state rotational anisotropy for rhA3C WT, S144A, and Q44R/H45R/S144A. Apparent Kd values are shown in the figure with the standard deviation. (E) Processivity of rhA3C S144A and Q44R/H45R/S144A calculated from the time course in (A–B) demonstrated that it was not increased above WT rhA3C. The processivity factor measures the likelihood of a processive deamination over a nonprocessive deamination and is described further in the ‘Materials and Methods‘ section. (A, D, E) On the graphs, the standard deviation for three independent experiments is shown as error bars.
