
Figure 3.
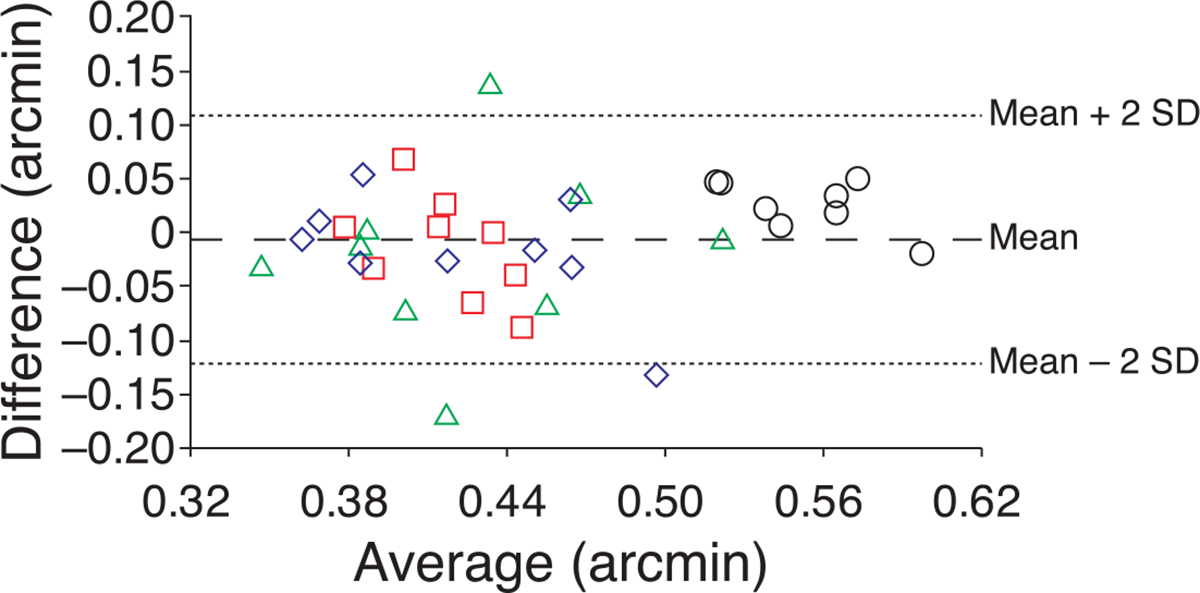
Bland–Altman plot shows good agreement between results obtained in each AO condition. The difference (3 mm–5.81 mm) is plotted versus the mean. The MARs (in arcmin) obtained in the 3-mm and 5.81-mm AO-corrected conditions were similar for all observers. The mean difference was very close to zero (−0.007 arcmin) and the SD was 0.057 arcmin. Observers S1–S4 are shown as red squares, blue diamonds, green triangles, and black circles, respectively. This figure includes all measurements obtained with AO correction, including measurements from the untrained eyes.