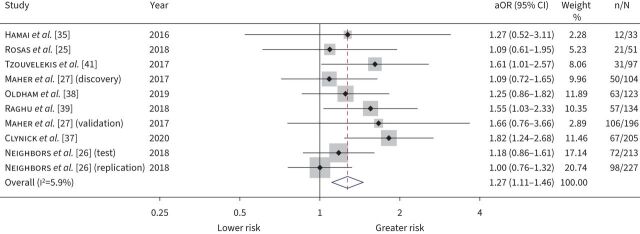
FIGURE 5.
Disease progression forest plot. Pooled adjusted odds ratios (aOR) with 95% confidence intervals for risk of disease progression, per standard deviation increase in baseline matrix metalloproteinase-7. All estimates were adjusted for age, sex, smoking status and baseline forced vital capacity. Weights are from random-effects model.

