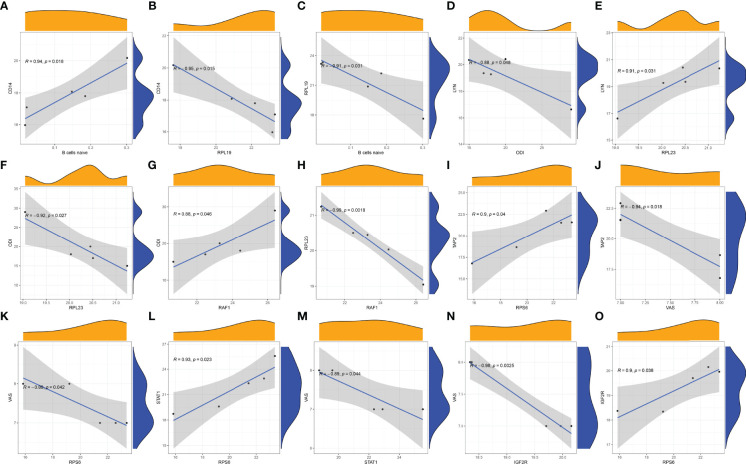
Figure 10.
Correlation analysis was plotted. (A) Correlation analysis of B cells naive and CD14. (B) Correlation analysis of RPL19 and CD14. (C) Correlation analysis of B cells naive and RPL19. (D) Correlation analysis of LYN and ODI. (E) Correlation analysis of RPL23 and LYN. (F) Correlation analysis of RPL23 and ODI. (G) Correlation analysis of RAF1 and ODI. (H) Correlation analysis of RPL23 and RAF1. (I) Correlation analysis of TAP2 and RPS6. (J) Correlation analysis of TAP2 and VAS. (K) Correlation analysis of RPS6 and VAS. (L) Correlation analysis of RPS6 and STAT1. (M) Correlation analysis of STAT1and VAS. (N) Correlation analysis of IGF2R and VAS. (O) Correlation analysis of RPS6 and IGF2R.

