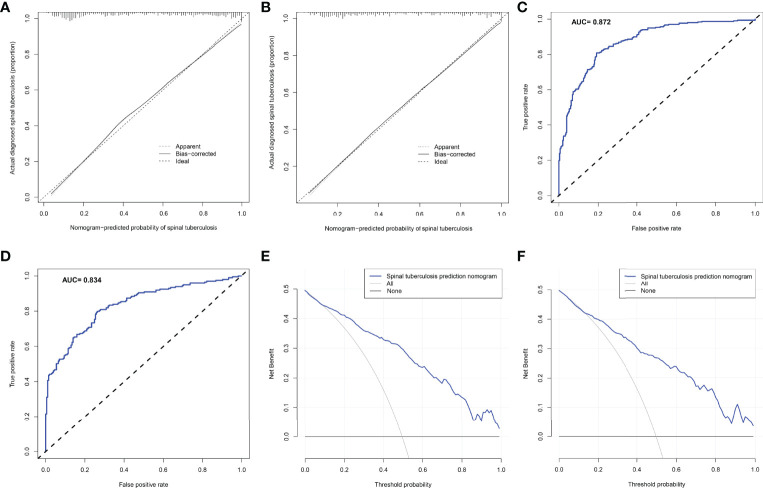
Figure 4.
The predictive ability and accuracy of the nomogram model was evaluated. (A) The calibration curve for the training set showed that the nomogram predicted risk of spinal tuberculosis was highly consistent with the actual diagnosis of spinal tuberculosis. (B) The calibration curve for the external validation set showed that the predicted and actual values were also highly consistent. (C) The ROC curve of the training set showed that the AUC of the nomogram model for predicting spinal tuberculosis was 0.862. (D) The ROC curve of the external validation set calculated the AUC to be 0.834. (E) The DCA curve of the training set showed that the net benefit of the predictive model ranged from 0.01 to 0.99. (F), The DCA curve of the external validation set showed that the net benefit of the predictive model also ranged from 0.01 to 0.99.

