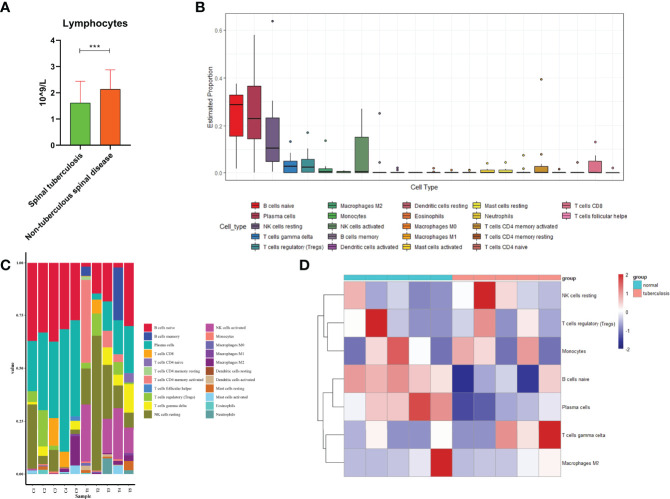
Figure 5.
Immune cells analysis. (A) Comparison of lymphocytes in spinal tuberculosis and nontuberculous spinal disease. (B) The estimated distribution of 22 immune cells was plotted. (C) The expression ratio of 22 immune cells in each sample was plotted. (D) Heatmap showed expression of immune cells in spinal tuberculosis and non-spinal tuberculosis tissues and showed that the expression of B cells naive former tissues was lower than that in the latter tissues. ***:P<0.001.

