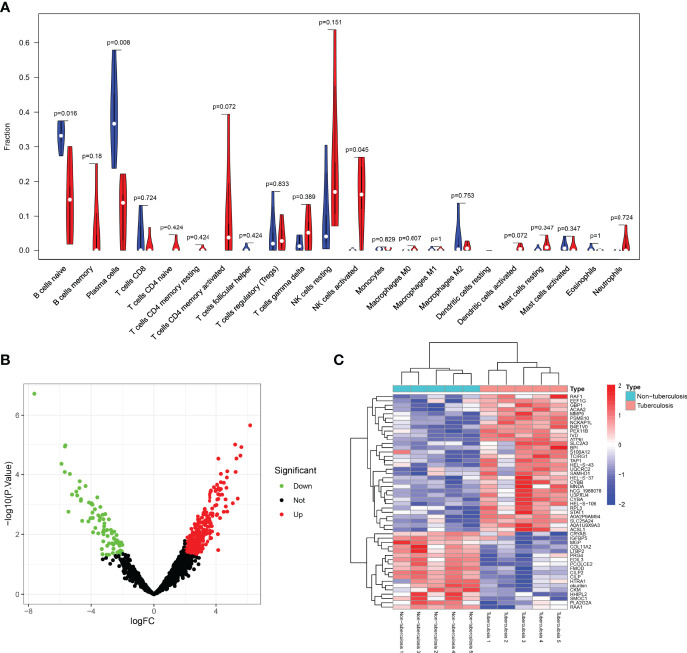
Figure 6.
Violin, volcano, and heatmap were plotted. (A) The comparison of 22 immune cell scores in spinal tuberculosis and non-spinal tuberculosis was plotted by the violin plot. There were statistical differences among the three types of immune cells, including B cells naive, platelet cells, and NK cells activated. (B) The volcano plot showed that the differential proteins were divided into up-regulated and down-regulated proteins. (C) The heatmap clearly showed the clustering of the top 50 proteins in spinal tuberculosis tissues and non-spinal tuberculosis tissues.

