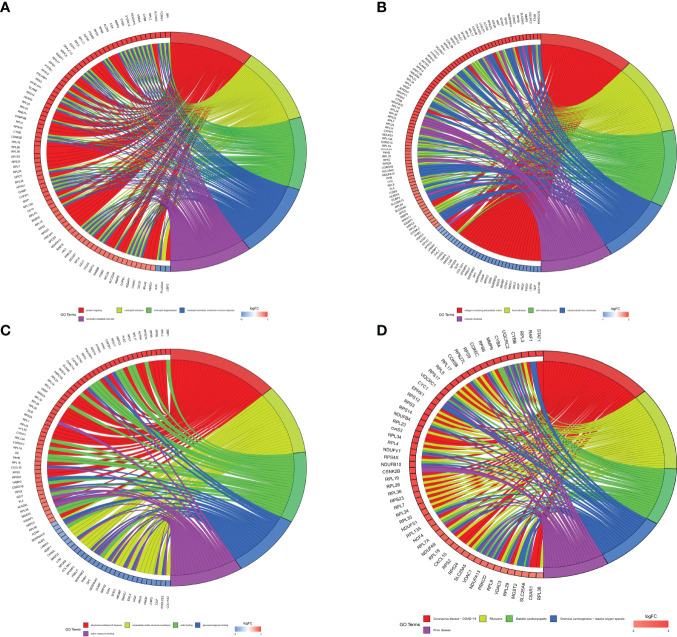
Figure 7.
GO and KEGG pathway enrichment analyses were plotted. (A) BP functional enrichment had 284 entries. The 5 entries with the most enriched protein counts were plotted. (B) CC functional enrichment had 284 entries. The 5 entries with the most enriched protein counts were plotted. (C) MF functional enrichment had 284 entries. The 5 entries with the most enriched protein counts were plotted. (D) KEGG pathway enrichment had 284 entries. The 5 entries with the most enriched protein counts were plotted.

