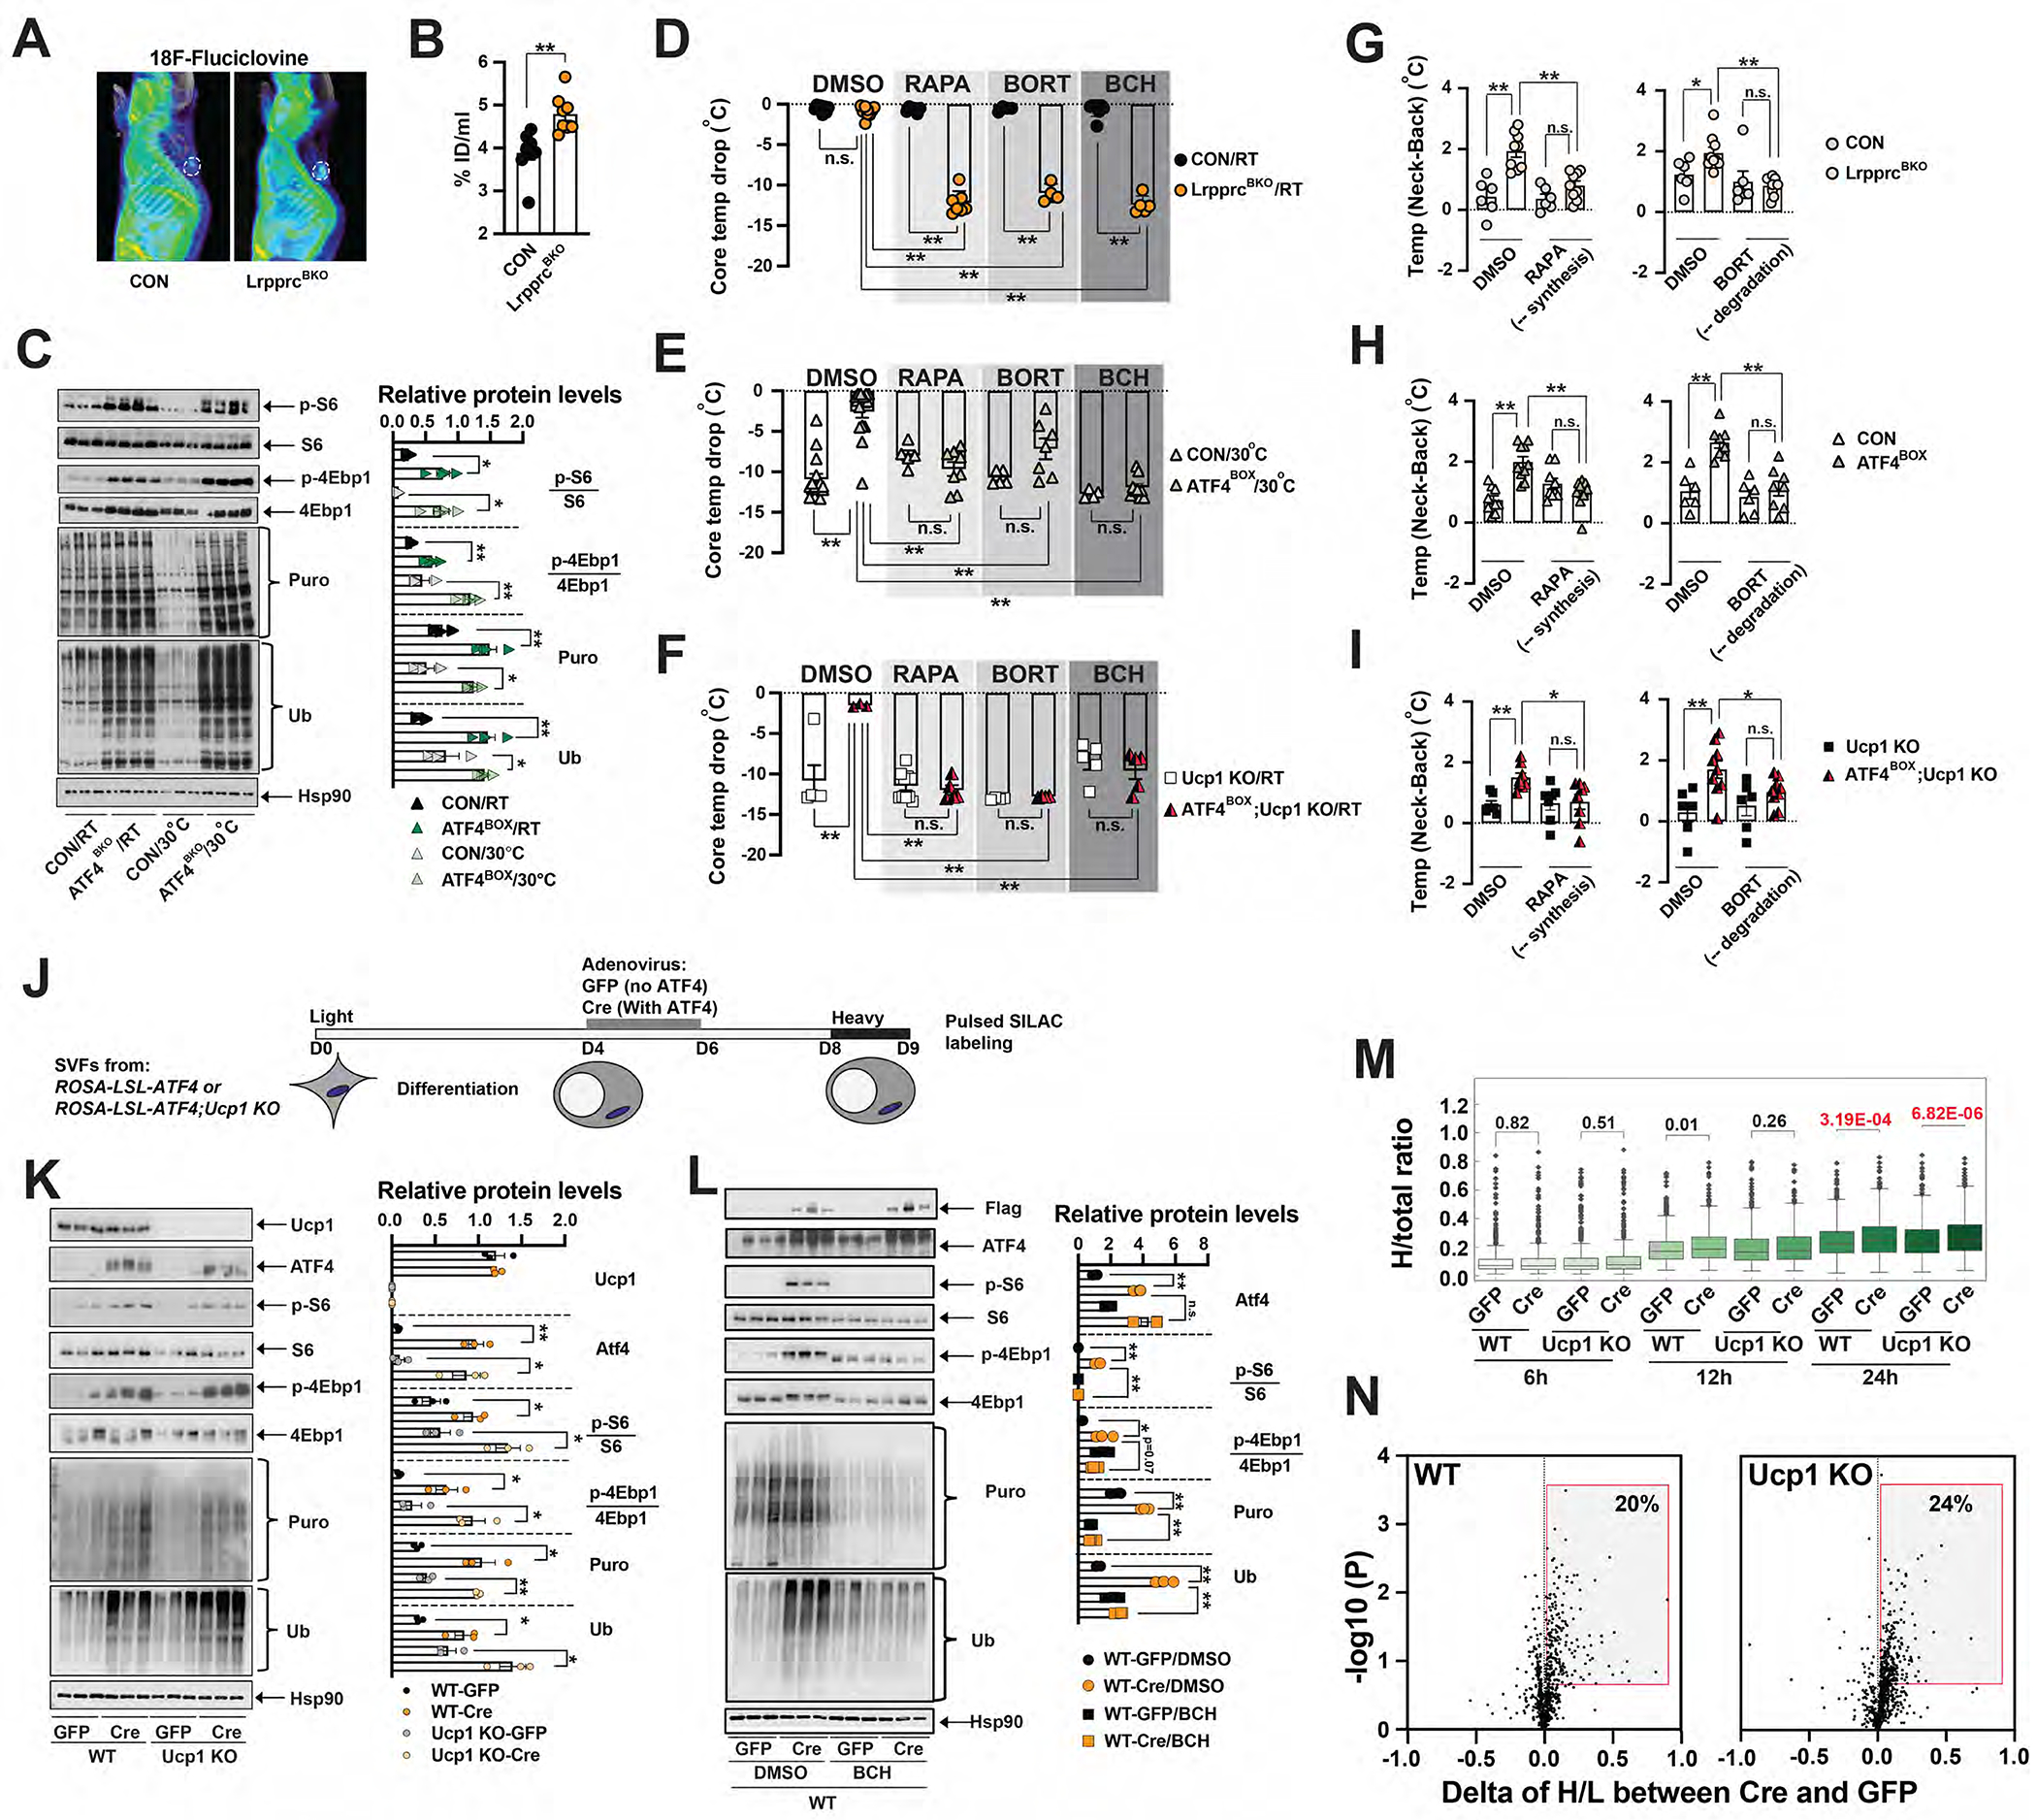
Figure 4. ATF4 activation induced cellular protein turnover in brown adipocytes.

3D rendering (A) and average values of 18F-Fluciclovine uptake (B) in ~10–12-week-old male CON and LrpprcBKO mice. White cycle: BAT. Sample size: CON (n=9) and LrpprcBKO (n=8). (C) Left: Immunoblots of p-S6, total S6, p-4Ebp1, total 4Ebp1, puromycylated protein, ubiquitinated protein and Hsp90 in the BAT of ~10-week-old male CON and ATF4BOX mice at ad libitum feeding at RT and 30°C. Right: Relative abundance (to Hsp90) or phosphorylation (to total protein) shown. Significance between genotypes indicated. (D) Core temperature drop of ~10-week-old male and female LrpprcBKO mice and their relative controls with pretreatment of DMSO, or 4mg kg−1 rapamycin (RAPA), or 0.625mg kg−1 bortezomib (BORT), or 50mg kg−1 BCH after 8 hours 4°C CTT from RT. Sample size: CON/RT/DMSO (n=9), LrpprcBKO/RT/DMSO (n=10), CON/RT/RAPA (n=6), LrpprcBKO/RT/RAPA (n=7), CON/RT/BORT (n=4), LrpprcBKO/RT/BORT (n=4), CON/RT/BCH (n=8) and LrpprcBKO/RT/BCH (n=5). (E) Core temperature drop of ~10-week-old male and female CON and ATF4BOX mice with pretreatment of DMSO or RAPA or BORT or BCH after 3 hours 4°C CTT from 30°C. Sample size: CON/30°C/DMSO (n=14), ATF4BOX/30°C/DMSO (n=14), CON/30°C/RAPA (n=5), ATF4BOX/30°C/RAPA (n=8), CON/30°C/BORT (n=5), ATF4BOX/30°C/BORT (n=7), CON/30°C/BCH (n=4) and ATF4BOX/30°C/BCH (n=9). (F) Core temperature drop of ~10-week-old male and female Ucp1 KO and ATF4BOX;Ucp1 KO mice with pretreatment of DMSO or RAPA or BORT or BCH after 3 hours 4°C CTT from RT. Sample size: Ucp1 KO/RT/DMSO (n=5), ATF4BOX;Ucp1 KO/RT/DMSO (n=3), Ucp1 KO/RT/RAPA (n=10), ATF4BOX;Ucp1 KO/RT/RAPA (n=5), Ucp1 KO/RT/BORT (n=4), ATF4BOX;Ucp1 KO/RT/BORT (n=4), Ucp1 KO/RT/BCH (n=5) and ATF4BOX;Ucp1 KO/RT/BCH (n=5). (G) The Temp (Neck-Back) of ~12-week-old male and female CON and LrpprcBKO mice 2 hours after injections of RAPA or BORT or DMSO at thermoneutrality. Sample size: CON (n=6) and LrpprcBKO (n=11). (H) The Temp (Neck-Back) of ~12-week-old male and female CON and ATF4BOX mice 2 hours after injections of RAPA or BORT or DMSO at thermoneutrality. Sample size: CON (n=7) and ATF4BOX (n=8). (I) The Temp (Neck-Back) of ~12-week-old male and female Ucp1 KO and ATF4BOX;Ucp1 KO mice 2 hours after injections of RAPA or BORT or DMSO at thermoneutrality. Sample size: Ucp1 KO (n=6) and ATF4BOX;Ucp1 KO (n=9). (J) Experimental setup of pSILAC in ATF4-expressing differentiated BAs. BAT SVF cells from ROSA-LSL-ATF4 or ROSA-LSL-ATF4;Ucp1 KO mice were cultured and differentiated in vitro. Four days after differentiation, GFP or Cre adenovirus were added at 100 MOI for two days. Cells were cultured in light medium from day 0 to 8, then transferred to heavy medium up to one day. Cells were collected at indicated time points for expression and mass spectrometry analyses. (K) Left: Immunoblots of Ucp1, Flag-ATF4, p-S6, total S6, p-4Ebp1, total 4Ebp1, puromycylated protein, ubiquitinated protein and Hsp90 in GFP or Cre-treated wild-type or Ucp1 KO BAs. Right: Relative abundance (to Hsp90) or phosphorylation (to total protein) shown. Significance between genotypes indicated. (L) Left: Immunoblots of Flag-ATF4, total ATF4, p-S6, total S6, p-4Ebp1, total 4Ebp1, puromycylated protein, ubiquitinated protein and Hsp90 in GFP or Cre-treated wild-type BAs after 4-hour treatment of 10 mM BCH or DMSO. Right: Relative abundance (to Hsp90) or phosphorylation (to total protein) shown. Significance between genotypes and treatment indicated. Data were presented as average ± SEM. Unpaired t-test. n.s.: non-significant; *: p<0.05 and **: p<0.01. (M) Box plot showing the fraction of heavy labeled over total protein in the GFP- or Cre-infected BAs in either wild-type (WT) or Ucp1 KO background at 6, 12, 24 hours post heavy medium switch. Welch’s 2-sided t-test performed. (N) Volcano plots showing the changes of H/L ratio between Cre- and GFP-infected BAs (X axis) and −log10 p value (Y axis) at 24-hour timepoint in WT and Ucp1 KO background. Grey box: proteins with higher turnover after ATF4-overexpression.
