
Figure 7. ATF4 activation in brown adipocytes is sufficient to improve systemic metabolism in wild-type and Ucp1 knockout mice.
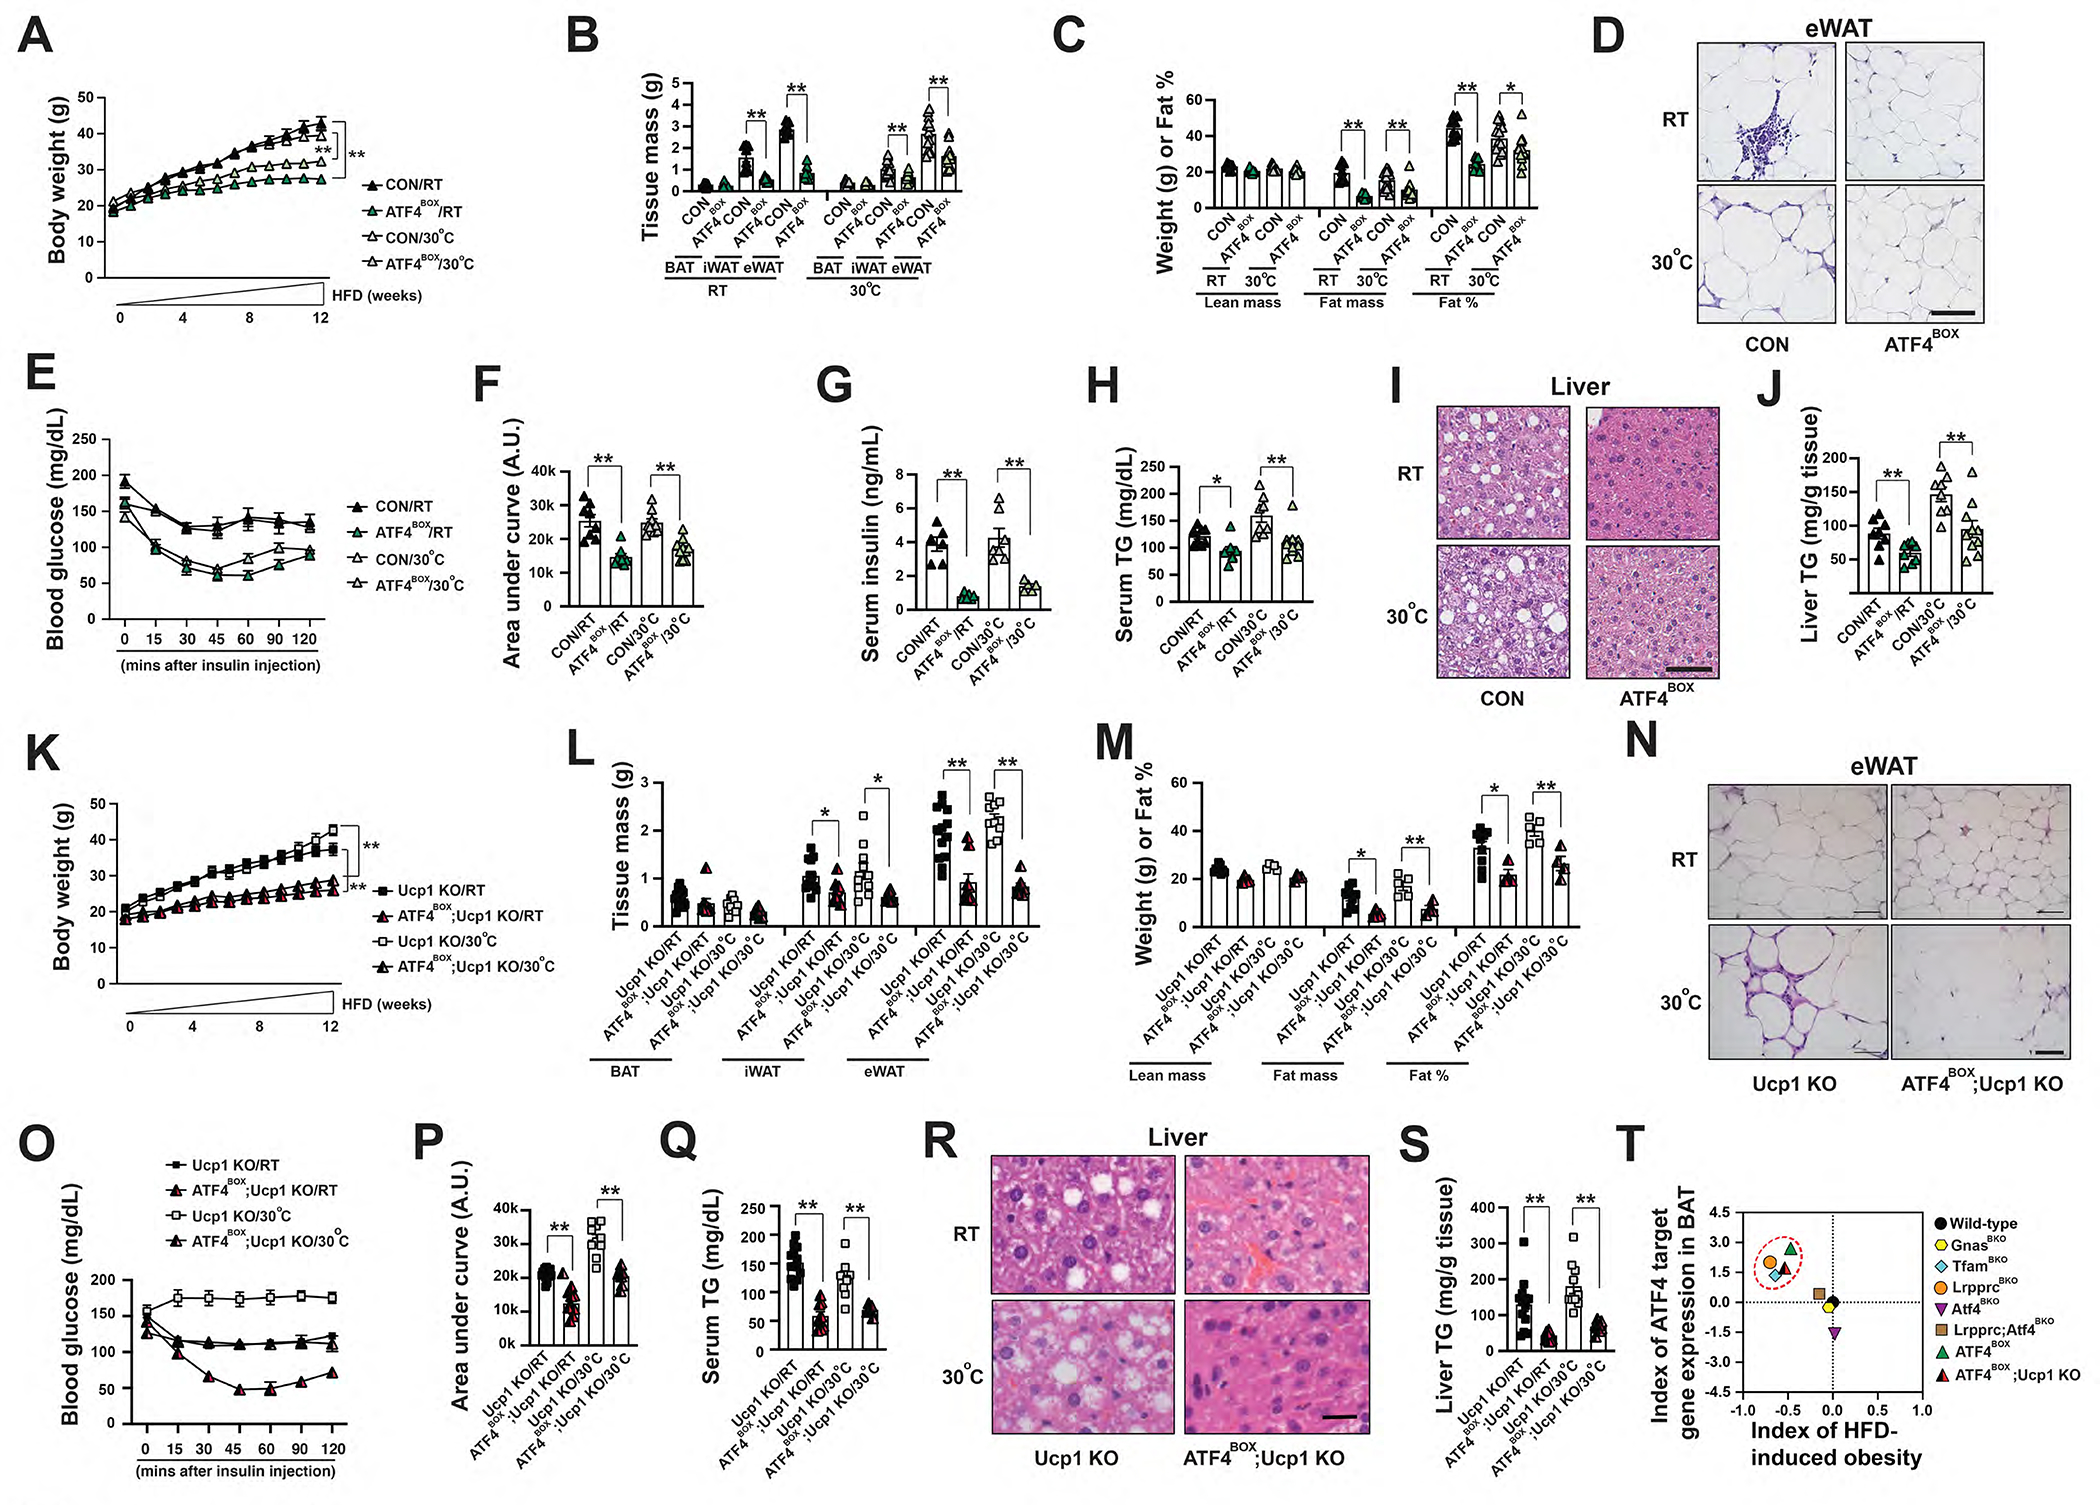
(A) Body weight of male CON and ATF4BOX mice after 12-week HFD at RT and 30°C. Sample size: CON/RT (n=8), ATF4BOX/RT (n=8), CON/30°C (n=17) and ATF4BOX/30°C (n=18). (B) Tissue mass of eWAT, iWAT, and BAT of male CON and ATF4BOX mice after 12-week HFD. Sample size: male CON/RT (n=8), ATF4BOX/RT (n=8), CON/30°C (n=13) and ATF4BOX/30°C (n=13). (C) Lean mass, fat mass, and fat percentage of male CON and LrpprcBKO mice after 12-week HFD. Sample size: CON/RT (n=8), ATF4BOX/RT (n=8), CON/30°C (n=13) and ATF4BOX/30°C (n=13). (D) Representative H&E staining of eWAT from male CON and ATF4BOX mice after 12-week HFD. Scale bar: 50 μm. (E) Serum glucose levels during ITT in male CON and ATF4BOX mice after 12-week HFD at RT and 30°C. (F) Area under the curve (AUC) values of glucose levels in ITTs showed. Sample size: CON/RT (n=8), ATF4BOX/RT (n=8), CON/30°C (n=9) and ATF4BOX/30°C (n=10). (G) Serum insulin levels in male CON and ATF4BOX mice after 12-week HFD. Sample size: CON/RT (n=6), ATF4BOX/RT (n=6), CON/30°C (n=7), ATF4BOX/30°C (n=5). (H) Serum triglyceride contents of male CON and ATF4BOX mice after 12-week HFD. Sample size: CON/RT (n=8), ATF4BOX/RT (n=8), CON/30°C (n=8) and ATF4BOX/30°C (n=10). (I) Representative H&E staining of liver from male CON and ATF4BOX mice after 12-week HFD. Scale bar: 50 μm. (J) Liver triglyceride contents of male CON and ATF4BOX mice after 12-week HFD. Sample size: CON/RT (n=8), ATF4BOX/RT (n=8), CON/30°C (n=8) and ATF4BOX/30°C (n=10). (K) Body weight of male Ucp1 KO and ATF4BOX;Ucp1 KO mice under 12-week HFD at RT and 30°C. Sample size: Ucp1 KO/RT (n=9), ATF4BOX;Ucp1 KO/RT (n=4), Ucp1 KO/30°C (n=5), and ATF4BOX;Ucp1 KO/30°C (n=4). (L) Tissue mass of eWAT, iWAT, and BAT of male Ucp1 KO and ATF4BOX;Ucp1 KO mice after 12-week HFD at RT and 30°C. (M) Lean mass, fat mass, and fat percentage of male Ucp1 KO and ATF4BOX;Ucp1 KO mice after 12-week HFD at RT and 30°C. Sample size: Ucp1 KO/RT (n=9), ATF4BOX;Ucp1 KO/RT (n=4), Ucp1 KO/30°C (n=5), and ATF4BOX;Ucp1 KO/30°C (n=4). (N) Representative H&E staining of eWAT from male CON and ATF4BOX mice after 12-week HFD. Scale bar: 50 μm. (O) Serum glucose levels during ITT in male Ucp1 KO and ATF4BOX;Ucp1 KO mice after 12-week HFD at RT and 30°C. (P) Area under the curve (AUC) values of glucose levels in ITTs showed. Sample size: Ucp1 KO/RT (n=9), ATF4BOX;Ucp1 KO/RT (n=4), Ucp1 KO/30°C (n=5), and ATF4BOX;Ucp1 KO/30°C (n=4). (Q) Serum triglyceride contents of male Ucp1 KO and ATF4BOX;Ucp1 KO mice after 12-week HFD at RT and 30°C. Sample size: Ucp1 KO/RT (n=9), ATF4BOX;Ucp1 KO/RT (n=4), Ucp1 KO/30°C (n=5), and ATF4BOX;Ucp1 KO/30°C (n=4). (R) Representative H&E staining of liver from male CON and ATF4BOX mice after 12-week HFD. Scale bar: 25 μm. (S) Liver triglyceride contents of male Ucp1 KO and ATF4BOX;Ucp1 KO mice after 12-week HFD at RT and 30°C. Sample size: Ucp1 KO/RT (n=9), ATF4BOX;Ucp1 KO/RT (n=4), Ucp1 KO/30°C (n=5), and ATF4BOX;Ucp1 KO/30°C (n=4). Data were presented as average ± SEM. Unpaired t-test. *: p<0.05 and **: p<0.01. (T) Scatter plots showing index of HFD-induced obesity (the Log2 fold-change values of body weight after HFD) as the function of ATF4 activation in BAs (the average Log2 fold-change of ATF4 target genes in BAT). Dashed red cycle: LrpprcBKO, TfamBKO, ATF4BOX and ATF4BOX;Ucp1 KO mice that exhibited enhanced cellular proteome turnover and reduced HFD-induced obesity.