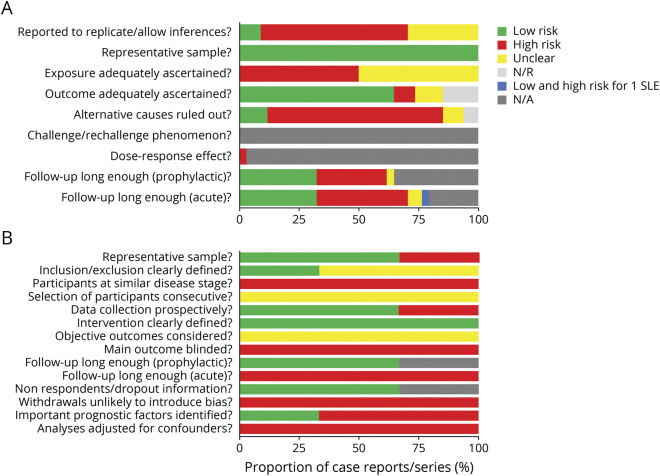
Figure 2. Quality Appraisal and Risk of Bias.
Risk of bias for case reports and case series (n = 34), evaluated with the tool developed by Murad et al.e1 Color denotes the risk of bias (see legend), defined by meeting the criteria standards for each domain (on the y-axis). Each article was individually appraised. The x-axis represents the combined proportion of case reports/case series. eTable 7, links.lww.com/WNL/B836, gives the individual article appraisal. (B) Quality appraisal and risk of bias for cohort and open-label trials (n=3). Risk of bias for all other study design was evaluated via a risk-of-bias checklist for nonrandomized studies developed by Brazzelli et al.e2 Color denotes the risk of bias (see legend), defined by meeting the criteria standards for each domain (on the y-axis). Each article was individually appraised. The x-axis represents the combined proportion of case reports/case series. eTable 8 gives the individual article appraisal. N/A = not applicable; N/R = not reported; SLE = stroke-like episode.

