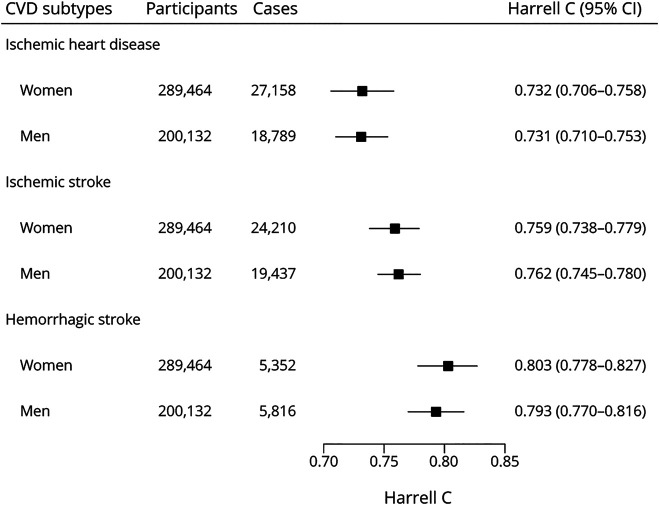
Figure 2. Harrell C Statistics of the CKB-CVD Models.
Harrell C was calculated using an internal–external cross-validation approach in which each study region was left out of the model fit and used in validation in turn. Harrell C shown is the result of pooling Harrell C from each external study region. CKB = China Kadoorie Biobank; CVD = cardiovascular diseases.

