
Figure 4. Bootstrap Distribution of Average Prediction Error of the Complete Regression Model.
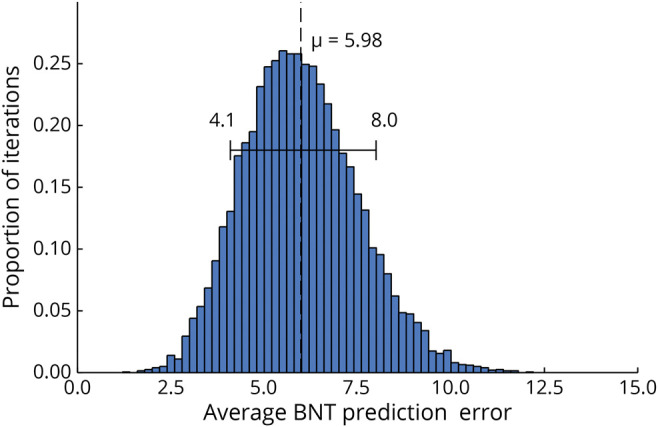
Each model was fitted with 90% of the patients and error measured with the held back 10%. Bootstrap distribution was created by repeating this using random resampling for 10,000 iterations. Mean error is shown as the dashed line, with the range denoting the 10% and 90% quantiles. BNT = Boston Naming Test.