FIGURE 1.

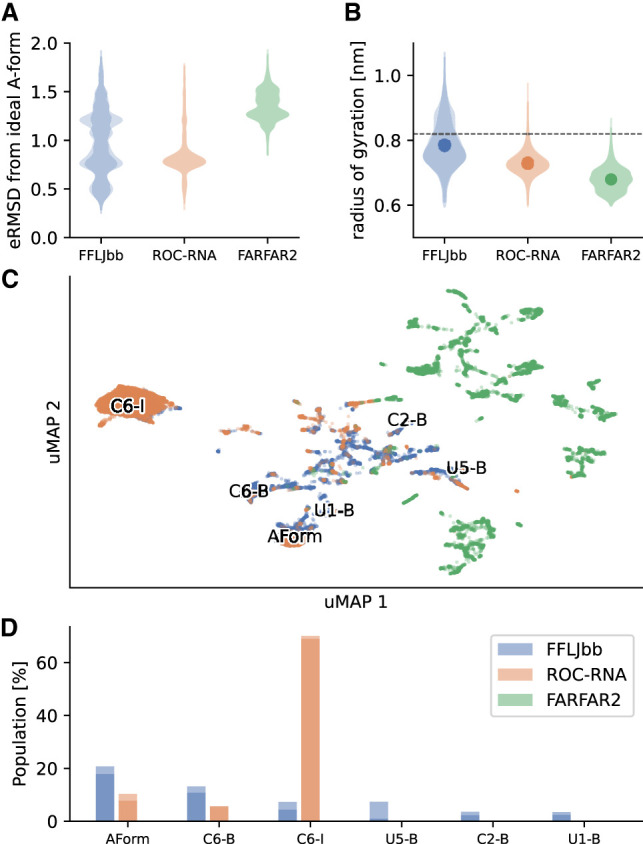
Structural analysis of r(UCAAUC) simulations. (A) eRMSD from ideal A-form histograms. For each ensemble, the distributions calculated for two replicates are shown in shade. (B) Radii of gyration distributions of the three ensembles, as labeled. Averages are shown as dots, and the horizontal dashed line indicates the radius of gyration of an ideal A-form structure. (C) MD simulations and FARFAR2 samples projected onto a uMAP 1/uMAP2 plane. The color scheme follows panels A and B: FFLJbb in blue, ROC-RNA in orange, and FARFAR2 in green. The structures discussed in the main text are labeled on the plane: A-form-like structures (Aform), C6-inverted (C6-I), C6-bulged (C6-B), U5-bulged (U5-B), C2-bulged (C2-B), and U1-bulged (U1-B) structures. (D) Population of different clusters, as labeled. The populations in FARFAR2 ensembles are zero for all clusters.
