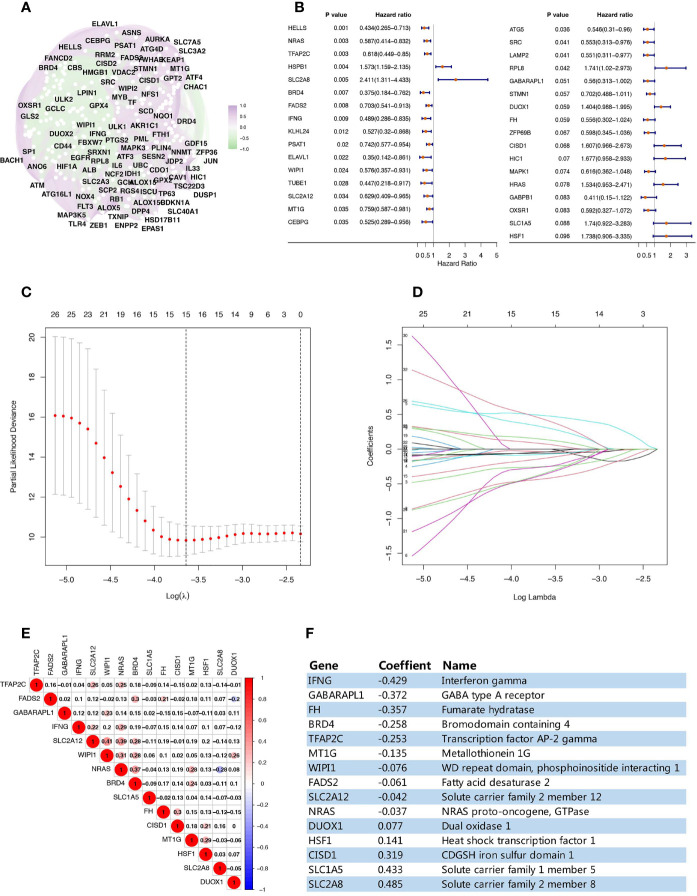
Figure 1.
Establishment of a prognostic ferroptosis-related gene pattern. (A) Correlation analysis of the ferroptosis-related genes. (B) Forest plots interpreting the univariate Cox analysis results between ferroptosis-related genes expression and OS. (C) Variables filtering based on Lasso regression. (D) Each curve represents the change trajectory of each ferroptosis-related genes coefficient. (E) Corplot showing the pairwise correlation analysis of these 15 ferroptosis-related genes. (F) The prognostic regression model established by LASSO regression analysis.

