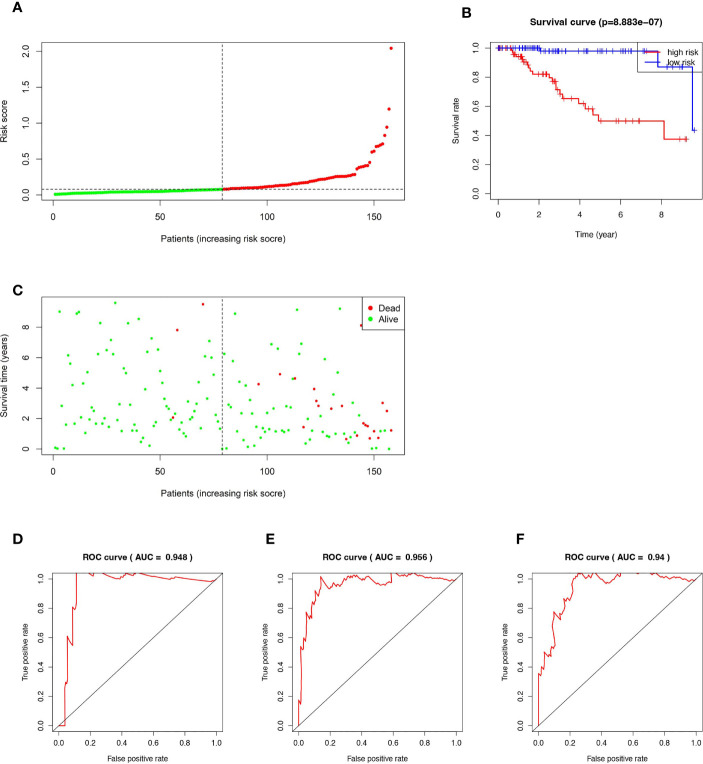
Figure 2.
Kaplan–Meier curve, Time-dependent ROC curve, Risk score analysis and Survival status analysis of the 15-ferroptosis-related gene signature. (A) Risk score analysis for the 15-ferroptosis-related gene signature. (B) Kaplan–Meier curve of 15-ferroptosis-related gene signature in the TCGA cohort. (C) Survival status analysis for the 15-ferroptosis-related gene signature. (D–F) The time-dependent ROC curve of 1-, 3-, 5-year OS of the 15-ferroptosis-related gene signature in the TCGA cohort.

