
Figure 3.
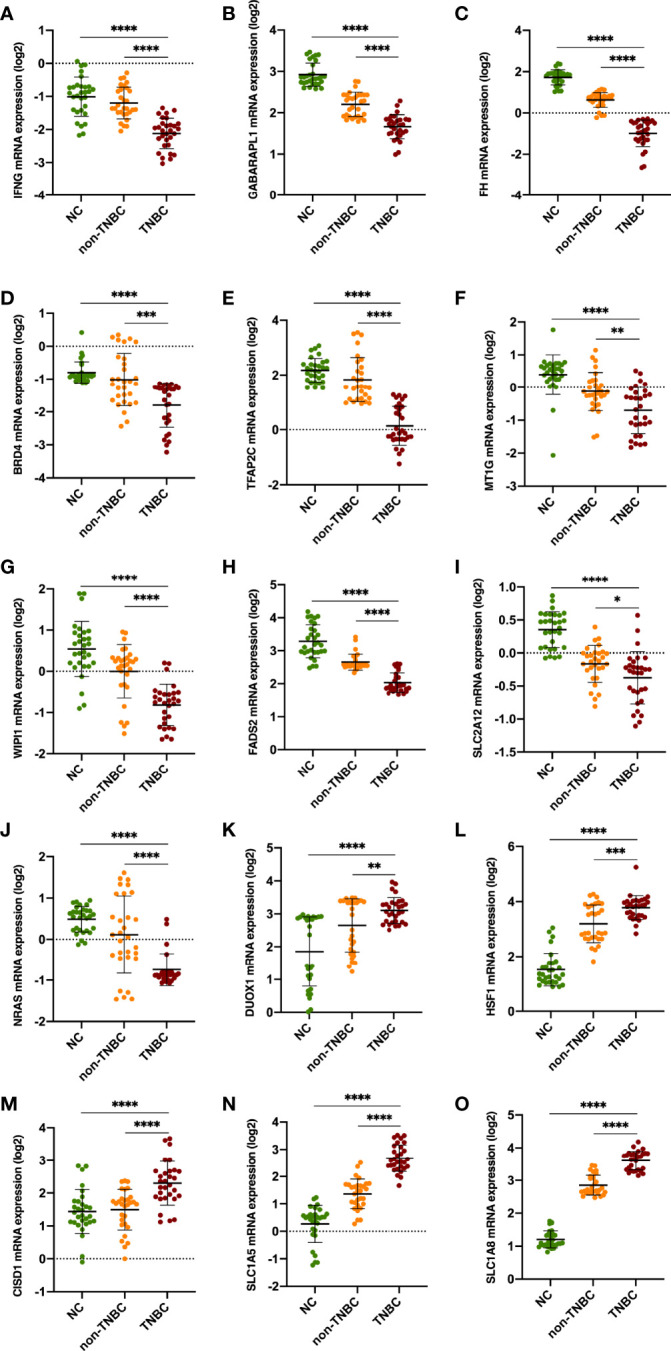
Validation of the expression levels of the 15 ferroptosis‐related genes in clinical specimens. Student’s t-test (two-tailed) was used for the comparison analyses. *P < 0.05, **P < 0.01, ***P < 0.001 ****P < 0.0001 respectively.
Official websites use .gov
A
.gov website belongs to an official
government organization in the United States.
Secure .gov websites use HTTPS
A lock (
) or https:// means you've safely
connected to the .gov website. Share sensitive
information only on official, secure websites.
Validation of the expression levels of the 15 ferroptosis‐related genes in clinical specimens. Student’s t-test (two-tailed) was used for the comparison analyses. *P < 0.05, **P < 0.01, ***P < 0.001 ****P < 0.0001 respectively.