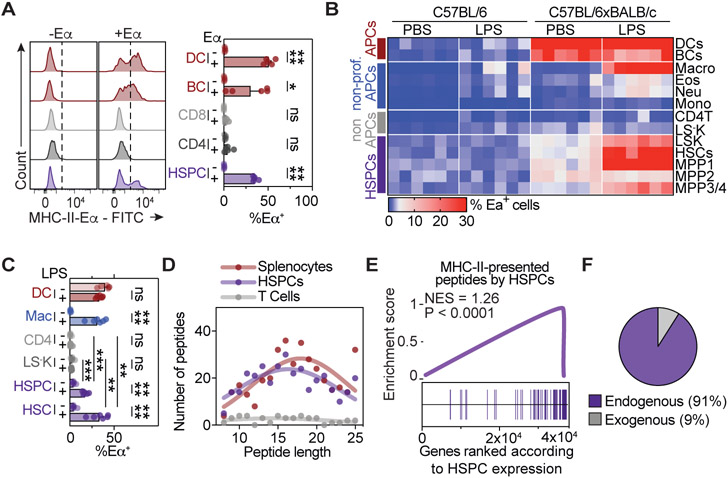
Figure 2. Mouse HSPCs present self-antigens via MHC-II.
See also Figure S1.
(A) Ex vivo antigen presentation assay. Representative histograms (left) and quantification (right), n=4.
(B and C) In vivo antigen presentation assay, n=6. (B) Heatmap summarizing the percentage of Eα presenting cells in C57BL/6xBALB/c mice and control C57BL/6 mice. (C) Quantification of selected populations in C57BL/6xBALB/c.
(D-F) Mass spectrometry analyses of peptides recovered from MHC-II of indicated populations. (D) MHC-II-eluted peptide size distribution. (E) Gene set enrichment analysis (GSEA) of presented peptides related to their gene expression in HSPCs. (F) MHC-II-derived peptides in HSPCs that are transcribed (endogenous) or not transcribed (exogenous) within HSPCs based on a threshold of 100 RPKM.
Individual values are shown in B and D, means and SEM are depicted otherwise. No significance = ns, P<0.05 *, P<0.01 **, P<0.001 ***, P<0.0001 ****. One- (A) or two-way ANOVA (C) were performed as discovery tests. Paired two-tailed t-test was performed in C. If not stated otherwise, unpaired two-tailed t-tests were performed as post-hoc tests.

