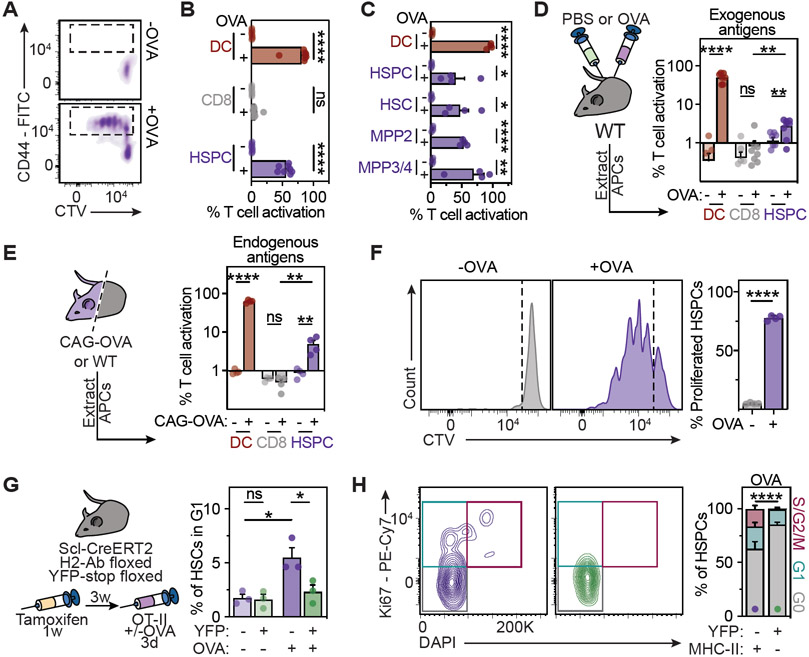
Figure 3. MHC-II mediates an antigen-specific bidirectional interaction between HSPCs and CD4+ T cells.
See also Figure S2.
(A and B) HSPCs activate naïve OT-II CD4+ T cells in co-culture assays, n=8. (A) Representative histograms of CD44 expression and cell trace violet (CTV). (B) Quantification of T cell activation.
(C) T cell activation assays for different HSPC subpopulations (2.5x10³ cells) as in 3A, n=4.
(D) In vivo antigen presentation assay for exogenous antigens. Experimental approach (left), quantification of T cell activation (right), n=8.
(E) In vivo antigen presentation assay for endogenous antigens. Experimental approach (left), quantification of T cell activation (right), n=4.
(F) Antigen presentation impacts on HSPC proliferation in co-culture assays with naïve OT-II CD4+ T cells (see methods). Representative plots (left) and quantification (right), n=4.
(G and H) In vivo antigen-specific HSPC-T cell interaction promotes HSPC cell cycle entry in a Scl-CreERT2 H2-Ab floxed YFP-stop floxed mouse model. (G) Experimental scheme (left), and cell cycle analyses (right). (H) Representative plots (left) and cell cycle analysis (right) of YFP+MHC-II− or YFP−MHC-II+ HSPCs from Cre+ mice, n=5.
Means and SEM are depicted. No significance = ns, P<0.05 *, P<0.01 **, P<0.001 ***, P<0.0001 ****. One- (B, C) or two-way ANOVA (D, E, G and H) were performed as discovery tests. Paired two-tailed t-test was performed in G. If not stated otherwise, unpaired two-tailed t-tests were performed as post-hoc tests.

