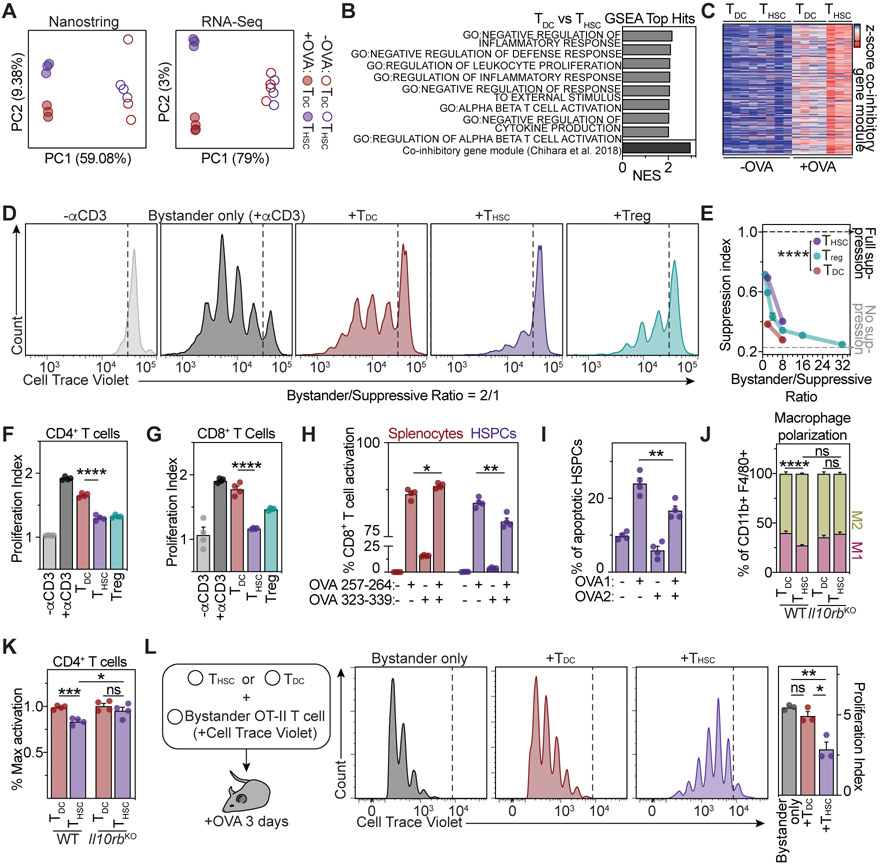
Figure 5. HSPC-mediated antigen presentation induces a suppressive phenotype in CD4+ T cells.
(A) Principle component analyses (PCA) of Nanostring (left) and RNA-Seq (right) gene expression of OT-II CD4+ T cells activated by HSPCs (THSCs) or dendritic cells (TDCs), n=3-4.
(B) Top THSC-enriched gene sets of gene set enrichment analyses (GSEA) of RNA-Seq data from (A), comparing THSCs and TDCs.
(C) Heatmap representing z-scored expressions of co-inhibitory module genes (Chihara et al., 2018).
(D-F and K) Ex vivo CD4+ T cell suppression assays. (D) Representative plots for the 1:2 suppressive/bystander naïve CD4+ T cell condition. (E) Suppression index for different bystander/suppressive ratios, n=4. (F) Proliferation index of responder CD4+ T cells for the 1:2 ratio, n=4.
(G) Ex vivo CD8+ T cell suppression assay, n=4.
(H and I) Ex vivo CD8+ T cell activation (H) and annexin V cytotoxicity assay (I), n=4. OVA1: ovalbumin 257-264, OVA2: ovalbumin 323-339.
(J) Ex vivo macrophage polarization assay, n=4.
(K) Role of IL-10 in THSC-mediated suppression. Activation of WT (left) or Il10rb−/− (right) bystander T cells in the presence of THSCs or TDCs in a 1:2 suppressive:bystander ratio., n=4.
(L) In vivo suppression assay. Representative plots (left) and quantification of bystander T cell proliferation (right), n=3.
Individual values are shown in A and C, means and SEM are depicted otherwise. No significance = ns, P<0.05 *, P<0.01 **, P<0.001 ***, P<0.0001 ****. One- (F, G, H, I, L) or two-way ANOVA (K) were performed as discovery test. Two-way ANOVA was performed in E and J. If not stated otherwise, unpaired two-tailed t-tests were performed as post-hoc tests.

