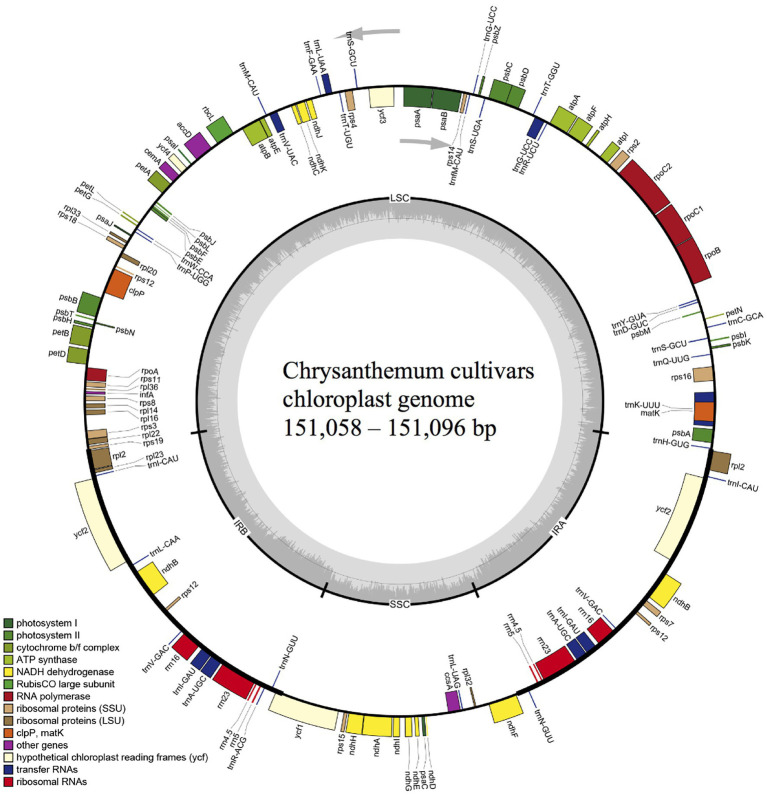
Figure 2.
Chloroplast genome map of 36 chrysanthemum cultivars. Genes transcribed clockwise and counter-clockwise are showed inside and outside the circle, respectively. Genes belonging to different functional groups are color-coded. Dark gray in the inner circle corresponds to GC content. LSC, large single copy region; SSC, small single copy region; IRA and IRB, inverted repeats.

