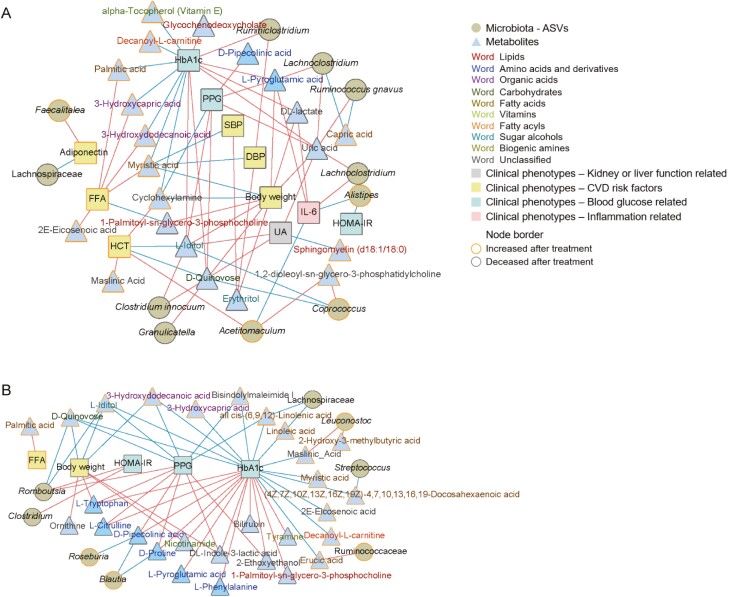
Figure 4.
Correlations in the alterations of the microbiota, metabolites, and clinical phenotypes in patients treated with empagliflozin or metformin. (A) Correlations in the changes in the microbiota, metabolites, and clinical phenotypes in patients treated with empagliflozin. (B) Correlations in the changes in the microbiota, metabolites, and clinical phenotypes in patients treated with metformin. Correlation coefficients were calculated using the method described by Bland and Altman. Red connections indicate the positive correlation (FDR < 0.05), whereas blue connections show correlations that were negative (FDR < 0.05). Abbreviations: DBP, diastolic blood pressure; FFA, free fatty acid; HbA1c, glycated hemoglobin; HOMA-IR, homeostasis model assessment of insulin resistance; IL-6, interleukin-6; PPG, postprandial plasma glucose; SBP, systolic blood pressure; UA, uric acid.

