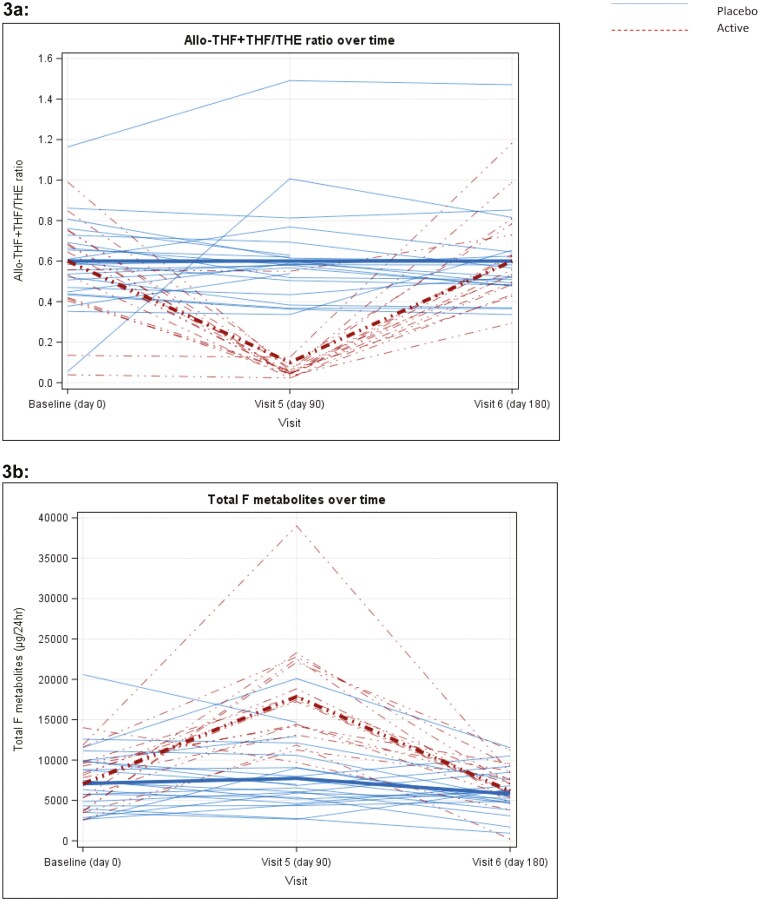
Figure 3.
3a, Plot of urinary (THF + alloTHF)/THE for each patient by study visit and treatment group (baseline [n = 49], day 90 [n = 42], day 180 [n = 43]). Mean values for each group represented by thick lines. 3b, Plot of total urinary cortisol (F) metabolites for each patient by study visit and treatment group. Mean values for each group represented by thick lines.

