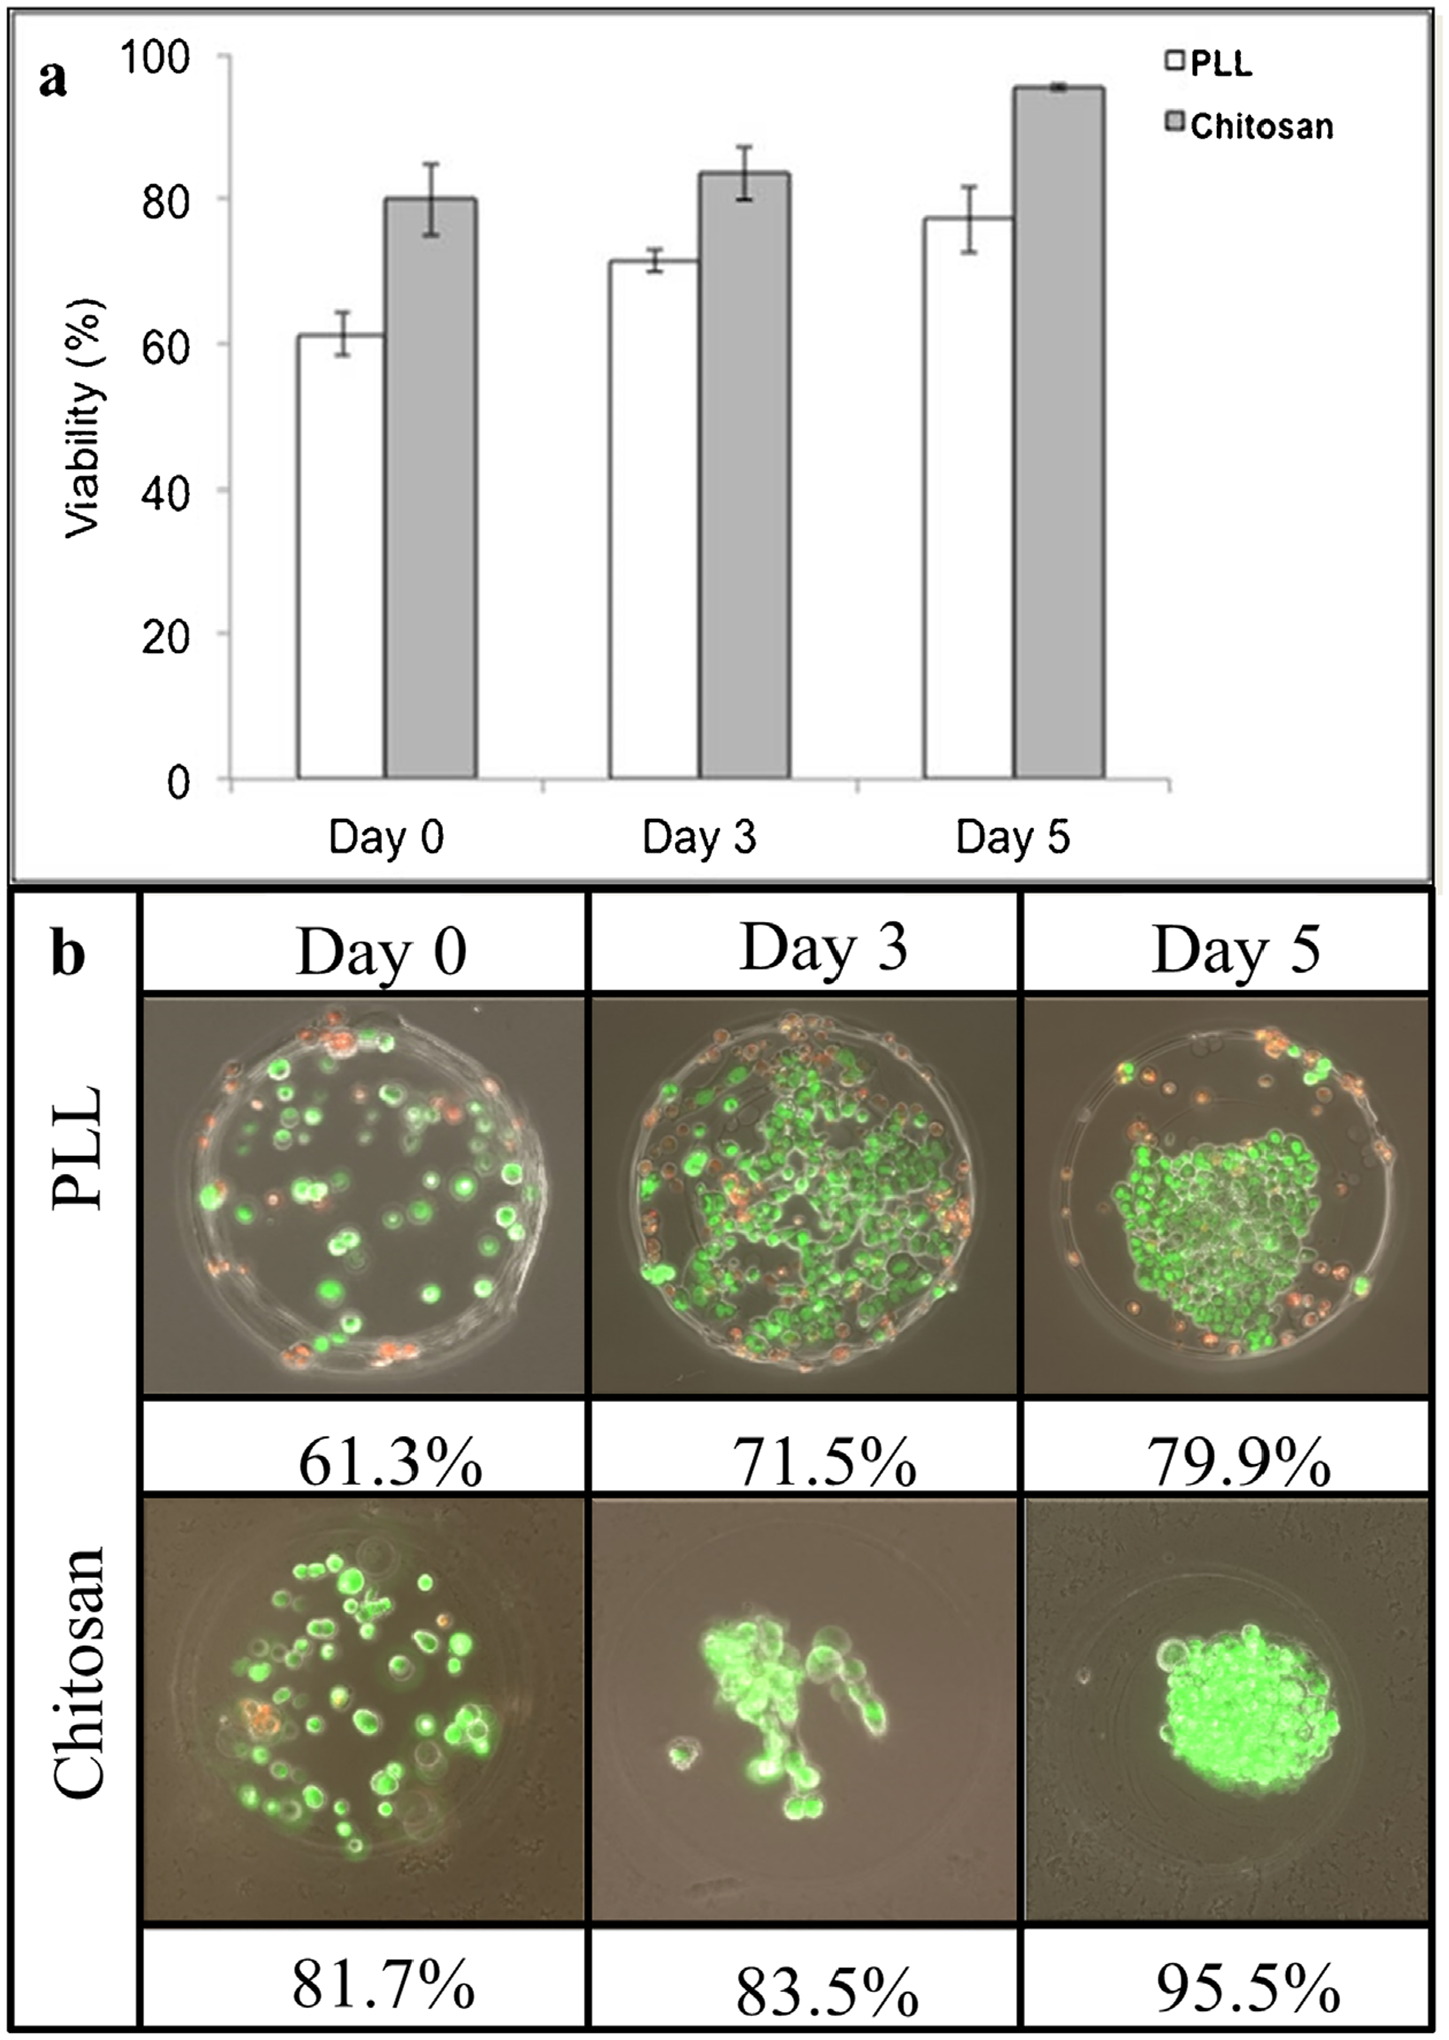
Figure 5.

Viability comparison of M231 cells in chitosan- and PLL-shelled microcapsules, over a 5-day time course. (a) Bar graph depiction of mean values ± standard deviation, (b) image set of time course with corresponding mean viability (green indicates living cells, while red indicates dead cells).
