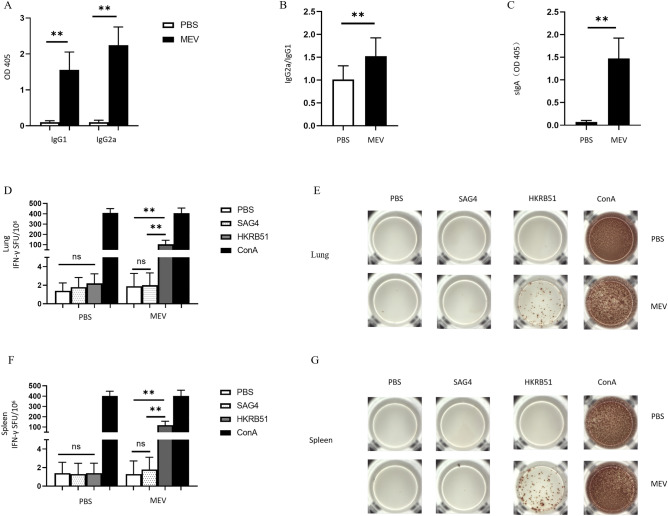
Figure 14.
(A) The specific IgG1, and IgG2a antibodies in the immunized mice serum. The white part represents the control group and the black part represents the MEV group (P < 0.01). (B) The IgG2a/IgG1 ratio of the two groups (P < 0.01). (C) The level of sIgA in bronchoalveolar lavage fluid of the two groups (P < 0.01). (D) The number of T cells that can produce IFN-γ in respiratory lymph node specimens after antigen stimulation. (E) The representative ELISPOT spot diagram. SAG4 peptide and PBS were used as negative controls, ConA was used as a positive control, and HKRB51 was used as the experimental group. (F) The number of T cells that can produce IFN-γ in splenocytes specimens after antigen stimulation. (G) The representative ELISPOT spot diagram. One-way ANOVA was used for the Statistical Analysis. Data are shown as mean ± SD. P < 0.05 was considered statistically significant (**P < 0.01).

