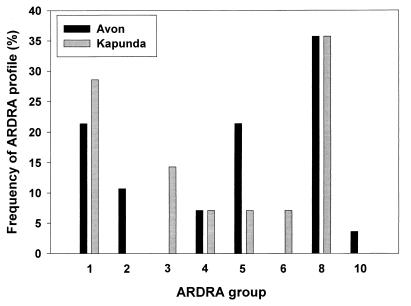
FIG. 2.
Frequency of ARDRA groups at each sampling site. Frequencies were obtained by dividing the number of isolates from each site represented in a particular group by the total number of isolates tested from that site. Most isolates analyzed were found to be either identical to P. brassicacearum and P. thivervalensis (group 8) or closely related to P. corrugata (group 1). Four groups contained isolates from a single site only; the total number of isolates in each of these groups ranged from one (groups 6 and 10) to three (group 2) (see Table 1 for details of isolate numbers).

