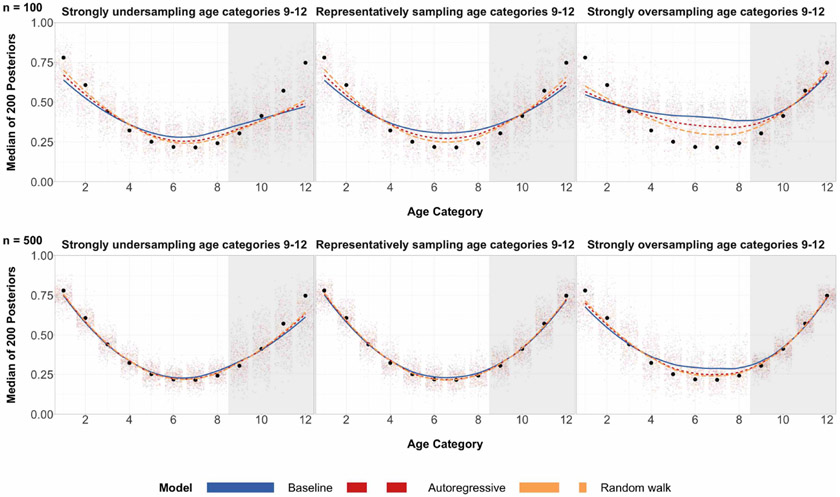
Figure 1:
Posterior medians for 200 simulations for each age group under three different regimes of data, where true age preference is U-shaped. The top row corresponds to a sample size of 100 and the bottom row corresponds to a sample size of 500. Black circles are true preferences for each age group. The shaded grey region corresponds to the age categories of older individuals for which we over/undersample. The left column has a probability of sampling age categories 9-12 equal to 0.05. The middle column has a probability of sampling age categories 9-12 equal to 0.33, which is completely random sampling and representative sampling for all age categories. The right column has a probability of sampling age categories 9-12 equal to 0.82. Local regression is used for the smoothed estimates amongst the three prior specifications. For the same plots involving different probabilities of sampling, refer to Table 3 in the appendix.

