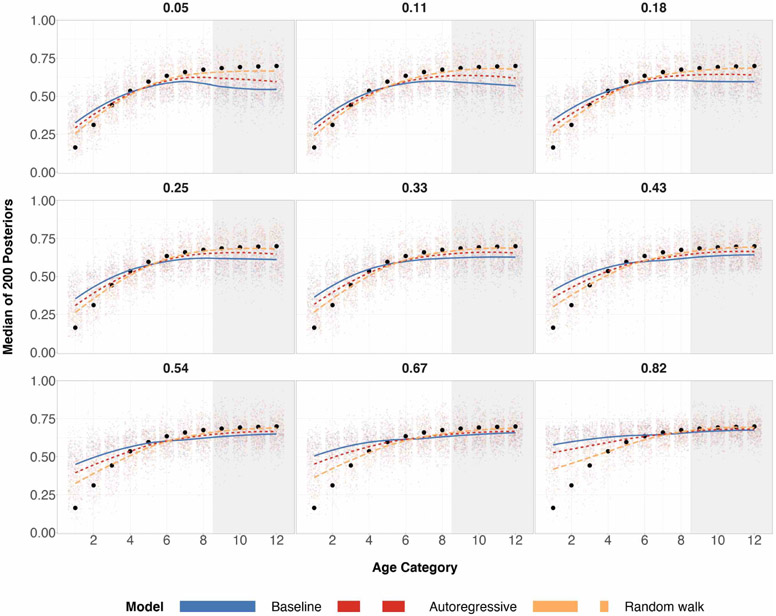
Figure 16:
Posterior medians for 200 simulations for each age group, where true age preference is increasing-shaped and sample size n = 100. Black circles are true preference probabilities for each age group. The numerical index for the 9 plots correspond to the expected proportion of the sample that are older adults (also known as the probability of sampling the subpopulation group with age categories 9–12). The shaded gray region corresponds to the age categories of older individuals for which we over/under sample. The center of the grid represents completely random sampling and representative sampling for age categories. Local regression is used for the smoothed estimates amongst the three prior specifications.

