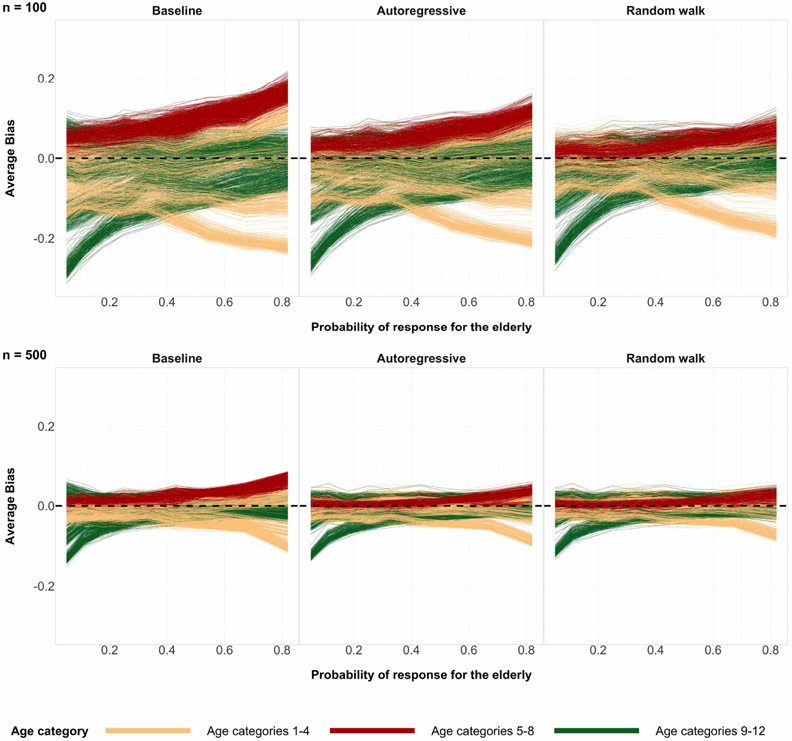
Figure 3:
The average bias values coming from 200 simulations of posterior medians of the 2448 poststratification cells. The possible values of average bias are in the interval (−1, 1). Sample size n = 100 (top) and n = 500 (bottom). The true preference curve for age is U-shaped. The horizontal dashed line at y = 0 represents zero bias.

