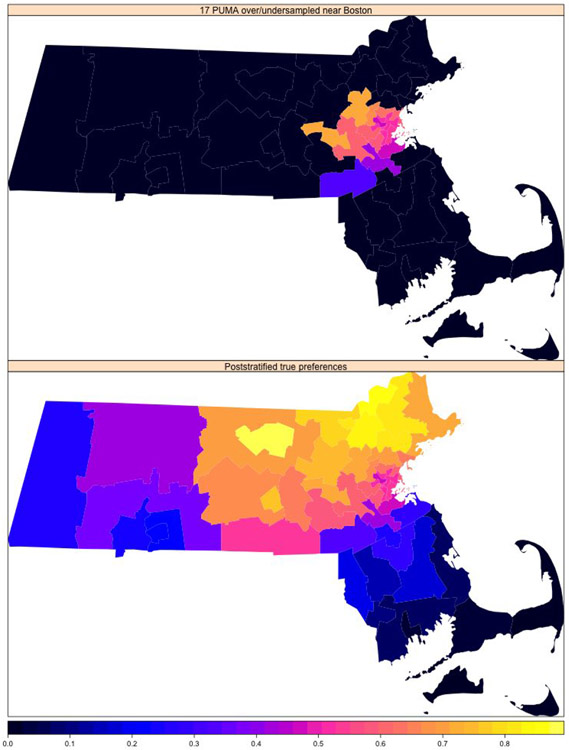
Figure 36:
True poststratified preference for 52 PUMA in Massachusetts is the bottom heatmap, which is the vector XPUMA. The top heatmap corresponds to the 17 PUMA near Boston that are over/undersampled. The true poststratified preference for PUMA j ∈ {1, … , 52} is defined as , where Sj corresponds to the index set for PUMA j and θk is the true preference for poststratification cell k.

