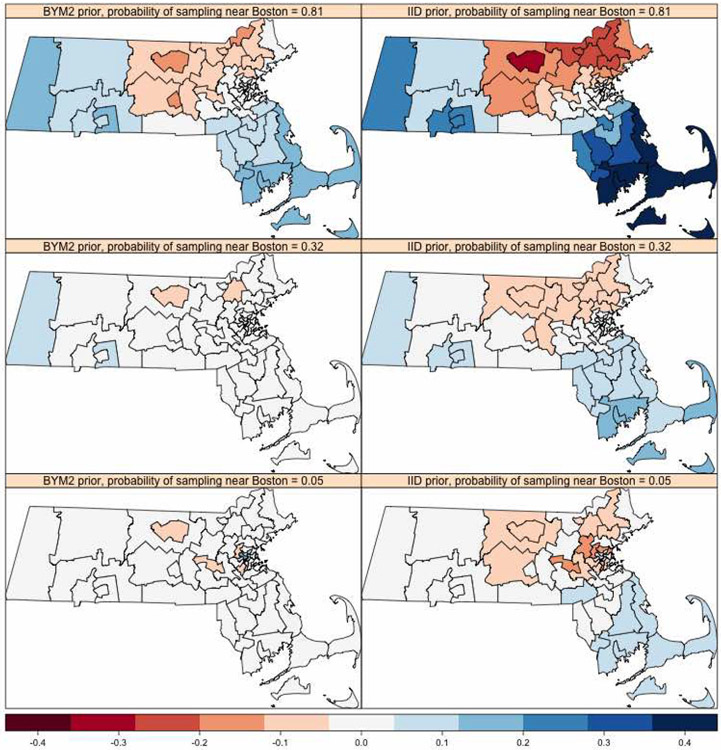
Figure 37:
Average bias of posterior medians for every PUMA based off 200 simulations and binary response sample size is 500. The possible values of average bias are in the interval (−1, 1). The left column corresponds to the BYM2 spatial prior for PUMA effect. The right column corresponds to an IID prior for PUMA effect. The probabilities 0.81, 0.32 and 0.05 in the top, middle and bottom rows respectively correspond to the probability of sampling an individual in Group 1, the cluster of 17 PUMA around Boston.

