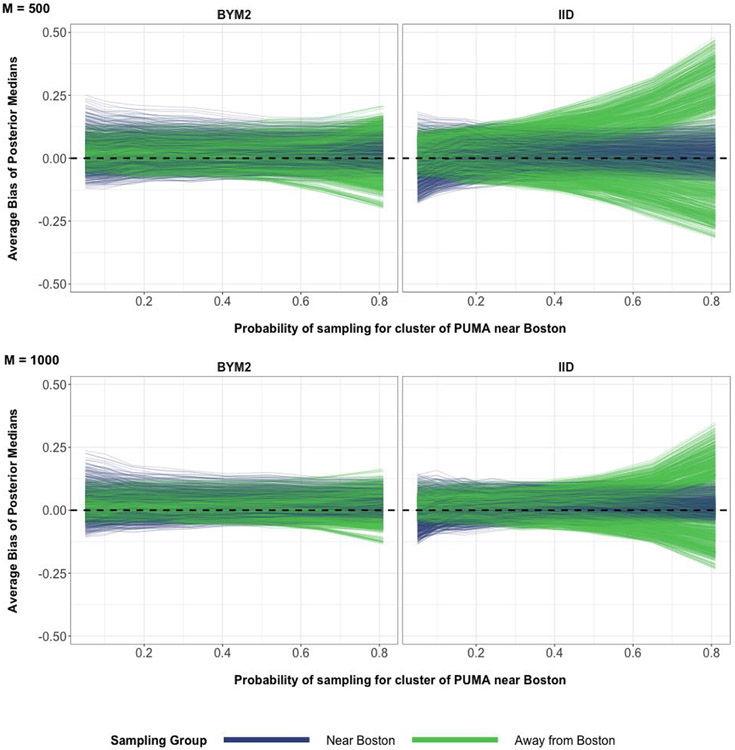
Figure 39:
The average bias values coming from 200 simulations of posterior medians of the 1872 poststratification cells for the spatial MRP simulation. The possible values of average bias are in the interval (−1, 1). M is the number of binary responses in every simulated data set. The top row corresponds to 500 binary responses used to define binomial responses for every simulation iteration. The bottom row corresponds to 1000 binary responses used to define binomial responses for every simulation iteration. The horizontal dashed line at y = 0 represents zero bias.

