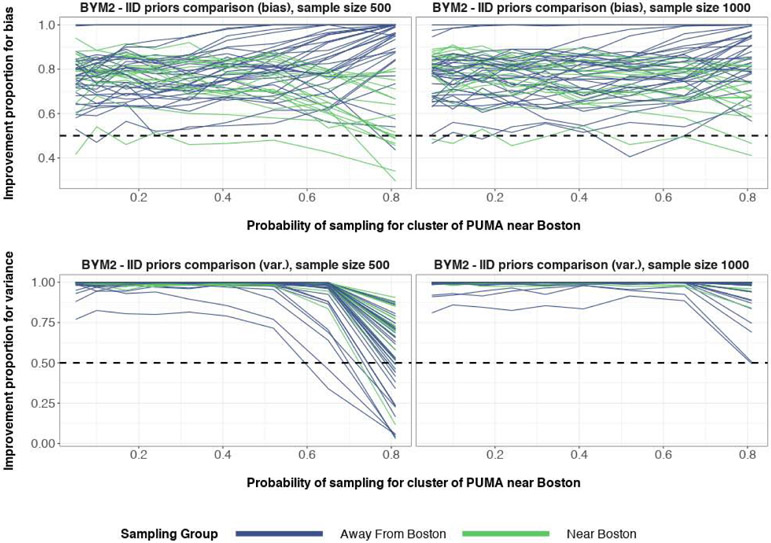
Figure 42:
The top row corresponds to the proportion of the time that spatial BYM2 priors have lower absolute posterior median bias when compared to IID baseline priors, for each PUMA. The bottom row corresponds to the proportion of the time that spatial BYM2 priors have lower posterior variance when compared to IID baseline priors, for each PUMA. The left column corresponds to 500 binary responses in the sample. The right column corresponds to 1000 binary responses in the sample. The horizontal dashed line y = 0.5 corresponds to equal proportion. The difference of the 90th and 10th posterior quantiles is used as a measure for posterior variance.

