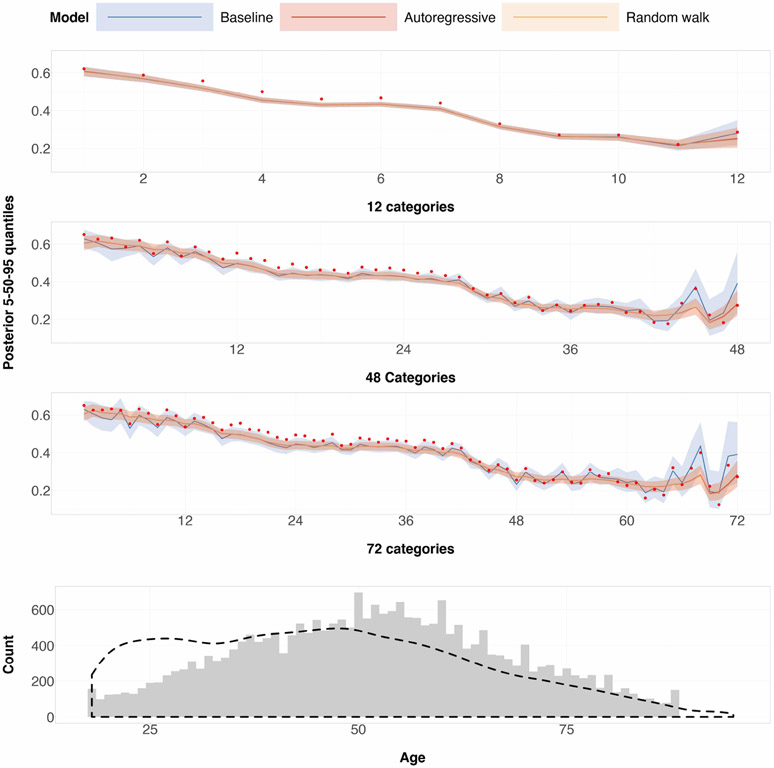
Figure 5:
12 (top), 48 (middle) and 72 (bottom) age categories. Red points in the top three plots are the empirical mean. The upper and lower bands in the top three plots correspond to the 95-percent and 5-percent posterior quantiles for every age category, and the middle solid line contains the posterior median for every age category. The density plot of ages in the ACS are coming from a random sample based off the 5-year ACS, where sampling is conducted with replacement using person weights given by the ACS. This random sample size is the same size as the 2008 Annenberg phone survey, and is assumed to be representative of the overall population defined by the 5-year ACS. 2000 iterations for 4 chains were run, for each prior specification and for age discretized into 12, 48 and 72 categories. The burn-in was set to 50 percent.

