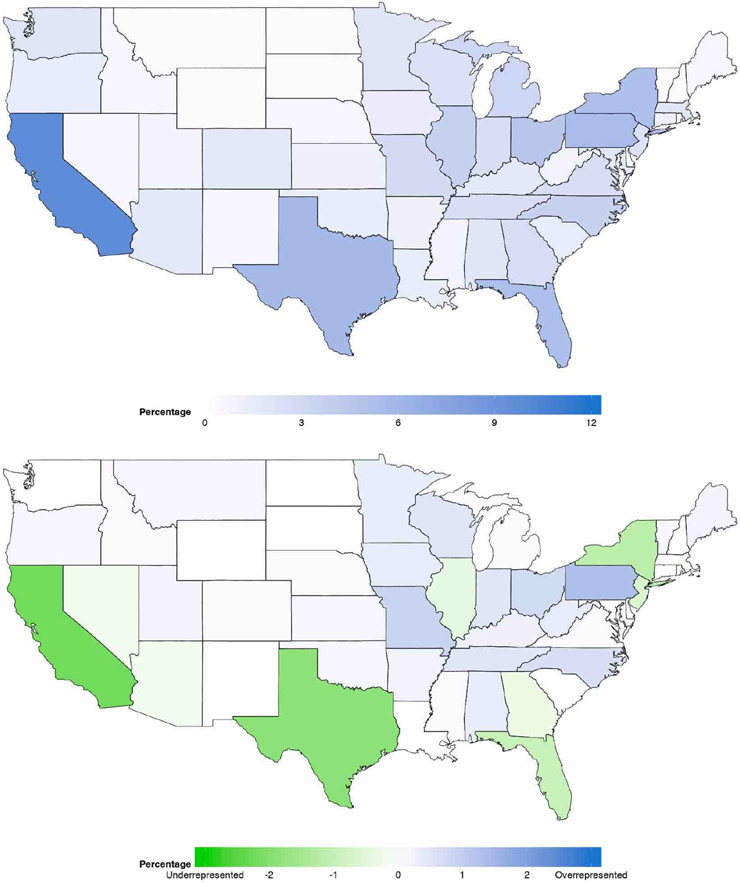
Figure 6:
Percentage proportions of data in every state for the Annenberg survey (top) and Annenberg percentage proportions - ACS percentage proportions (bottom). The proportions in both surveys were rounded to two decimal places. A state with green hues in the bottom heatmap corresponds to the Annenberg survey underrepresenting that particular state. A state with blue hues in the bottom heatmap corresponds to the Annenberg survey overrepresenting that particular state.

