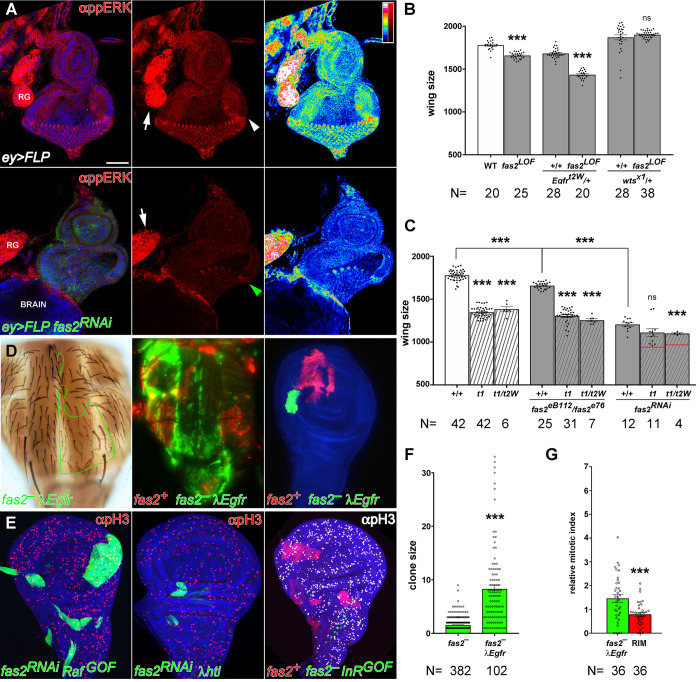
Fig 5. The EGFR signaling pathway mediates the Fas2 cell autonomous function to promote imaginal disc growth.
(A) Eye imaginal discs deficient for Fas2 display reduced levels of activated-MAPK (anti-ppERK). Top panels, strong expression of activated-MAPK is evident in the Morphogenetic Furrow of the eye disc (white arrowhead) and the Ring Gland (RG, arrow) of control siblings (CyO balancer siblings). Bottom panels, in contrast ey-driven FLP-OUT eye discs expressing UAS-fas2RNAi (#34084) show a strong reduction of the ppERK signal, especially evident in the Morphogenetic Furrow (green arrowhead). Note that the Ring Gland (RG, white arrow), where ey-FLP is not expressed, serves as an internal control for the normal activated-MAPK signal. The right panels show a LUT color coded representation of activated-MAPK signal levels (signal quantified in S3B Fig). Bar: 50 μm. (B) The fas2 wing phenotype is sensitive to the dosage of the EGFR and wts genes. fas2eB112/fas2e76 wings show a reduction in size which is enhanced by a reduction of 50% in the dosage of EGFR (Egfrtop2w74/+). Reciprocally, the fas2 LOF phenotype is suppressed by a reduction of 50% in the dosage of wts (wtsX1/+) (WT and fas2eB112/fas2e76 as in Fig 1G). All individuals are female. Wing size is wing area in μm2/103. N is number of individuals. (C) Functional interactions between fas2 and Egfr LOF mutations. The size of fas2eB112/fas2e76 and fas2RNAi34084 (driven by heterozygous MS1096-GAL4/+) adult wings (grey bars) is significantly smaller than WT (white bar). Egfr hypomorphic combinations (Egfrtop1/Egfrtop1, t1, and Egfrtop1/Egfrtop2W74, t1/t2W) display a wing size smaller than WT and fas2eB112/fas2e76 (striped white bars), and more similar to that caused by the expression of UAS-fas2RNAi34084. The wing size of the double mutant combinations of fas2eB112/fas2e76 with the Egfr allelic combinations is more similar to the Egfr mutants (striped grey bars), and shows a clear epistatic interaction with the stronger fas2RNAi34084 condition. Note that the combination with Egfrtop1/Egfrtop2W74 still causes some enhancement, but far from the value expected for an additive effect of the fas2 and Egfr phenotypes (red lines). Controls as in Fig 1G. All individuals are female. Wing size is wing area in μm2/103. N is number of individuals. (D) Rescue of the fas2– phenotype by activated-EGFR (λEgfr) in adult (left), late pupa (middle) and the wing imaginal disc. At left, an adult fas2eB112 λEgfr MARCM clone in the notum marked with yellow and forked (outlined in green) showing a rescued size. Middle, fas2eB112 λEgfr coupled-MARCM clones in the notum (GFP) displaying a rescued size similar to their normal fas2+ control twins (labeled with mtdTomato). Right, fas2eB112 λEgfr coupled-MARCM clone and control twin (labeled with mtdTomato) in the wing disc. (E) Expression of activated-Raf (UAS-RafGOF), but not of activated-FGFR (UAS-λhtl) or activated-InR (UAS-InRDEL), rescues fas2-deficient clone growth. Left, 2nd instar larva FLP-OUT UAS-fas2RNAi#34084 UAS-RafGOF/+ clones. Middle, 2nd instar larva FLP-OUT UAS-fas2RNAi#34084 UAS-λhtl/+ clone. Right, 2nd instar larva coupled-MARCM fas2eB112; UAS-InRDEL/+ clones (GFP, absent) and their control twins (mtdTomato). A similar result was obtained with the expression of UAS-InRR418P. (F) y fas2eB112 f36a MARCM 2nd instar larva clone size in adults is rescued by activated EGFR (UAS-λEgfr/+). Clone size is number of y f36a chaetes. N is number of clones. (G) The mitotic index (relative to WT, as in Fig 2G) in fas2– λEgfr clones is highly increased, while the 2–3 cell rim of fas2+ cells around the clone shows the same value than in the rim of fas2+ cells around fas2– clones (compare with Fig 2G). N is number of clones.

