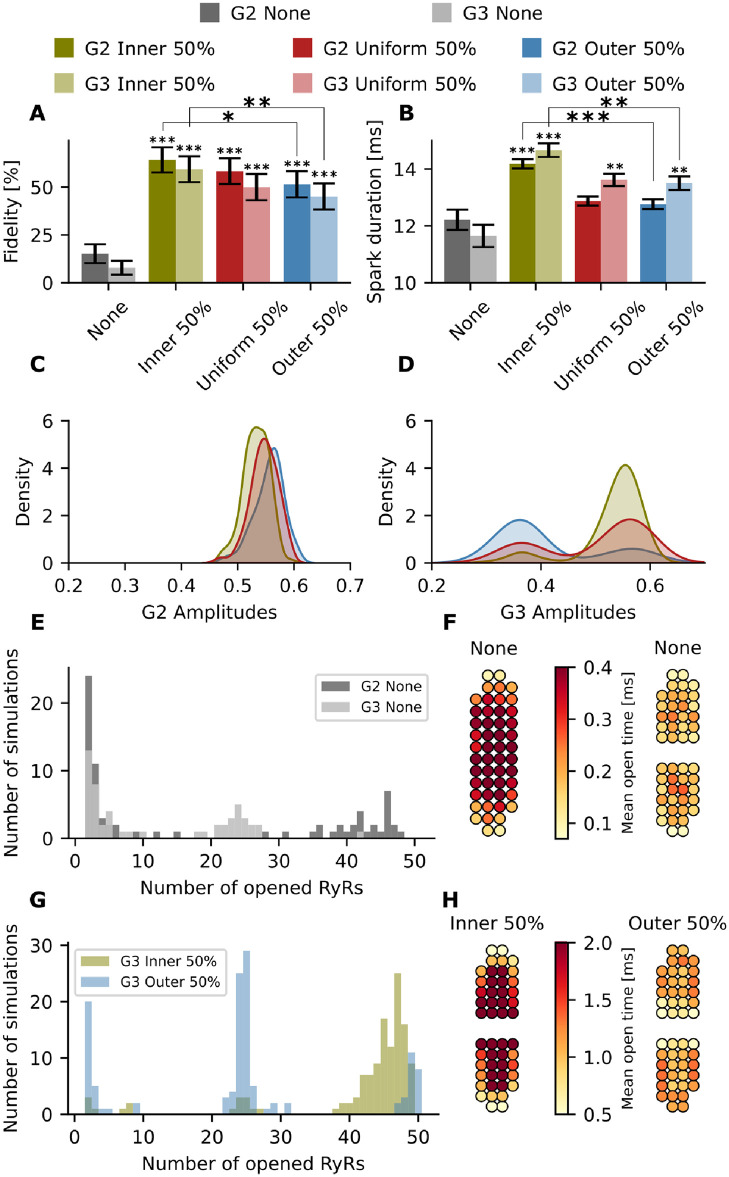
Fig 7. Effect of dispersed and phosphorylated RyR nanoclusters on spark properties.
Green: inner; red: uniform; blue: outer; gray: no phosphorylation. Opaque colours: G2; translucent colours: G3. (A) Spark fidelity for none, inner, uniform, and outer phosphorylation in G2 and G3. The black bars indicate the 95% Agresti-Coull confidence interval. (B) Spark duration (mean ± standard error) for none, inner, uniform, and outer phosphorylation in G2 and G3. (C) Kernel density estimate plot of the amplitudes for the three phosphorylation patterns in G2. (D) Kernel density estimate plot of the amplitudes for the three phosphorylation patterns in G3. (E) Histogram of opened RyRs per simulation for G2 and G3 with no phosphorylation. (F) Geometric visualization of mean open times for each RyR throughout all 200 simulations for G2 and G3 assuming no phosphorylation. (G) Histogram of opened RyRs per simulation for G3 with inner and outer phosphorylation. (H) Geometric visualization of mean open times for G3 with inner and outer phosphorylation. *=p<0.05, **=p<0.01 and ***=p<0.001. The p values were calculated with respect to the non phosphorylated case using a t-test, except for the fidelity p value which was calculated from Fisher’s exact test (due to binary data).

