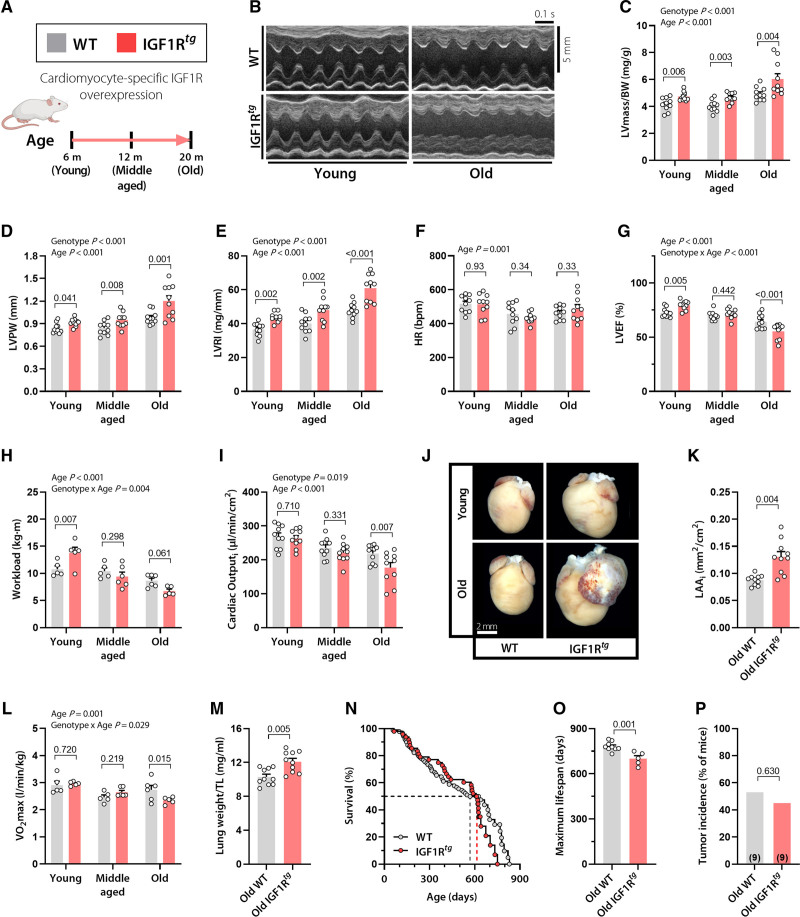
Figure 1.
Cardiac overexpression of IGF1R improves ejection fraction and effort tolerance in early adulthood, but causes heart failure and premature mortality late in life. A, Male mice with cardiomyocyte-specific overexpression of the human IGF1 receptor (IGF1Rtg) and their wild-type (WT) littermates (FVB/N background) were subjected to a comprehensive assessment of cardiac function and structure at the indicated age. B, Representative echocardiography-derived left ventricular (LV) M-mode tracings; C, LV mass normalized to body weight (BW); D, LV posterior wall thickness (LVPW); E, LV remodeling index (LVRI); F, heart rate (HR); and G, LV ejection fraction (LVEF) in 6-, 12-, and 20-month-old IGF1Rtg and WT mice (n=10 mice per group). H, Maximum workload during exercise tolerance testing in 3-, 12-, and 20-month-old IGF1Rtg and WT mice (n=5–6 mice per group). I, Body surface area–normalized cardiac output (cardiac index), derived by echocardiography, in IGF1Rtg and WT mice at the age of 6, 12, and 20 months (n=10 mice per group). J and K, Representative heart photomicrographs (J) and body surface area–normalized left atrial area (LAAi; K) in 20-month-old IGF1Rtg and WT mice (n=10 mice per group). L, Maximum oxygen consumption (Vo2max) during exercise tolerance testing in IGF1Rtg and WT mice at the age of 3, 12, and 20 months (n=5–6 mice per group). M, Lung weight normalized to tibia length (TL) in 20-month-old IGF1Rtg and WT mice (n=10 mice per group). N, Kaplan-Meier survival analysis of IGF1Rtg and WT mice (n=48/90 mice per group, respectively). Median survival is depicted by the dashed lines (please see also Table S3 for details). O, Maximum lifespan calculated as the average lifespan of the longest-lived decile in IGF1Rtg and WT mice (n=5/9 mice per group, respectively). P, Tumor incidence detected by gross necropsy in IGF1Rtg and WT mice (20/17 mice per group, respectively). Number in brackets indicates the number of mice that developed tumors. Indicated P values on top of panels (C–I and L) represent factor comparisons by 2-way ANOVA including genotype and age as fixed factors, followed by simple main effects analysis of pairwise comparisons between IGF1Rtg and their age-matched WT controls. Other P values were calculated by the Welch t test (K, M, and O) or χ2 test (P). Bars and error bars show means and SEM, respectively, with individual data points superimposed. IGF1 indicates insulin-like growth factor 1; IGF1R, IGF1 receptor; and IGF1Rtg mice, mice overexpressing human IGF1R specifically in cardiomyocytes.

