Figure 2.
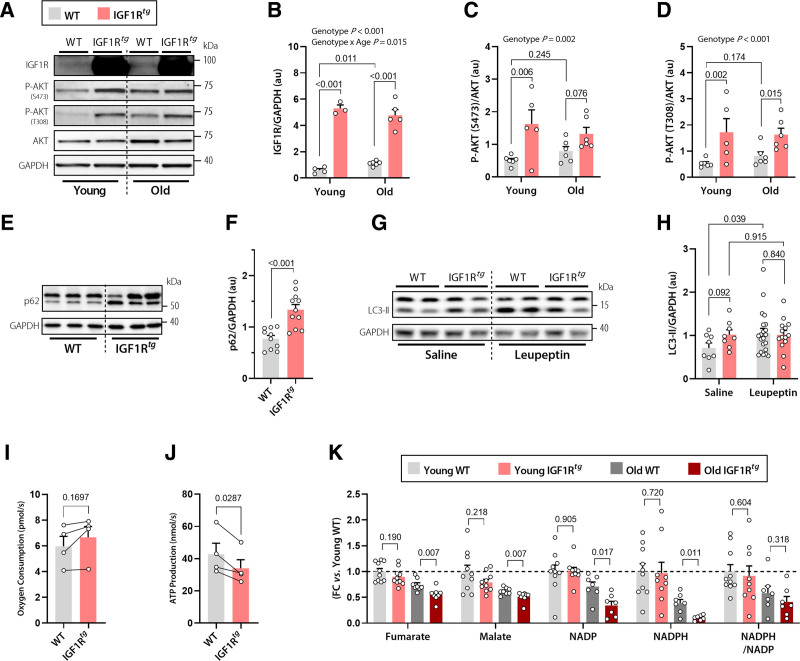
Impaired autophagy and mitochondrial oxidative capacity underlie the detrimental effect of cardiac IGF1R signaling in aged IGF1Rtg mice. A through D, Representative Western blots (A) and quantification (B) of cardiac IGF1 receptor (IGF1R) expression normalized to GAPDH, and AKT phosphorylation at Ser473 (C) and Thr308 normalized to total AKT expression (D) in 6-month-old (young) and 20-month-old (old) IGF1Rtg and WT mice (n=3–6 mice per group). E and F, Representative Western blots (E) and quantification of (F) the autophagy substrate p62 normalized to GAPDH in cardiac lysates of 12-month-old IGF1Rtg and WT mice (n=11/10 mice per group, respectively). G and H, Representative Western blots (G) and quantification of (H) the lipidated form of the autophagy marker LC3-II in the hearts of 12-month-old IGF1Rtg and WT mice that were treated with the protease inhibitor leupeptin (n=14/21 mice per group, respectively) or saline (n=8 mice per group). I and J, Paired assessment of oxygen consumption rate (I) and corresponding ATP production (J) in cardiac mitochondria isolated from 20-month-old IGF1Rtg and WT mice (n=4 mice per group). K, Relative difference in the tricarboxylic acid cycle intermediates, fumarate and malate, and the ratio between reduced and oxidized forms of the cofactor nicotinamide adenine dinucleotide phosphate (NADPH/NADP) in young (3 months old) and old (20 months old) IGF1Rtg and WT mice (n=7–10 mice per group). Indicated P values on top of panels (B–D and H) represent factor comparisons by 2-way ANOVA including genotype and age (B–D) or genotype and treatment (H) as fixed factors; the following simple main effects denote pairwise comparisons between IGF1Rtg and their respective WT controls within a specific age or treatment. Other P values were calculated by unpaired Welch t test or Mann-Whitney test (F and K) or paired Student t test (I and J). Bars and error bars show means and SEM, respectively, with individual data points superimposed. FC indicates fold change; IGF1, insulin-like growth factor 1; IGF1R, IGF1 receptor; IGF1Rtg mice, mice overexpressing human IGF1R specifically in cardiomyocytes; and WT, wild-type.

