. 2022 Jun 16;11:e75463. doi: 10.7554/eLife.75463

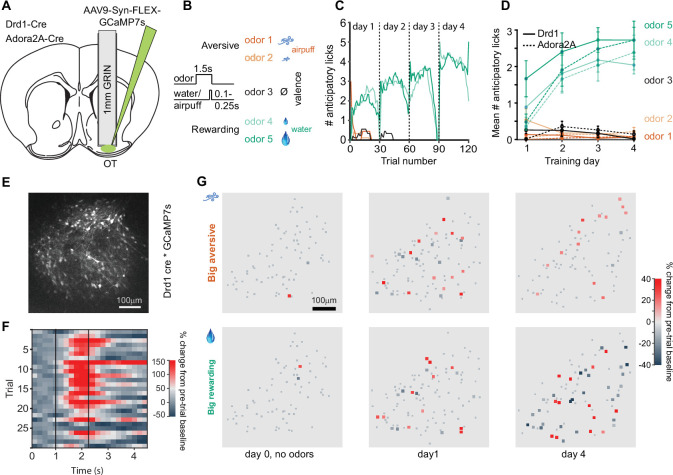
Figure 1. Two-photon calcium imaging of D1- and D2-type neurons in the olfactory tubercle (OT) during odor-outcome association learning.

(A) Cannula and Gradient-Index (GRIN) lens implantation targeting the OT in Drd1-Cre and Adora2A-Cre mice with AAV9-Syn-FLEX-GCaMP7s virus injection in the OT. (B) Odor-outcome task structure, odors 1–2 are paired with aversive airpuffs and odors 4–5 are paired with rewarding water drops in headfixed water restricted mice. Odor-outcome assignments are counterbalanced across mice. (C) Number of anticipatory licks in an example mouse in a 1 s period after odor onset and prior to water or airpuff delivery. Each training day has 30 trials of each of the five odors. (D) Mean number of anticipatory licks across 4 days of training in implanted Drd1-Cre mice (n=6, solid) and Adora2A-Cre mice (n=6, dashed). (E) Field of view of GCaMP7s expressing neurons in a Drd1-Cre mouse. (F) Example imaged neuron with activity in individual odor 5 trials in a single session. Dashed lines indicate odor onset and water onset. (G) Neuronal activity in field of view of a Drd1-Cre mouse in big airpuff and big water drop trials across days of training. Small gray dots indicate non-significantly responsive neurons. Day 0 indicates pre-training day in which no odors are presented, only water drops and airpuffs. Activity is shown in the 1 s period prior to outcome delivery, after odor onset in days 1 and 4.

Figure 1.

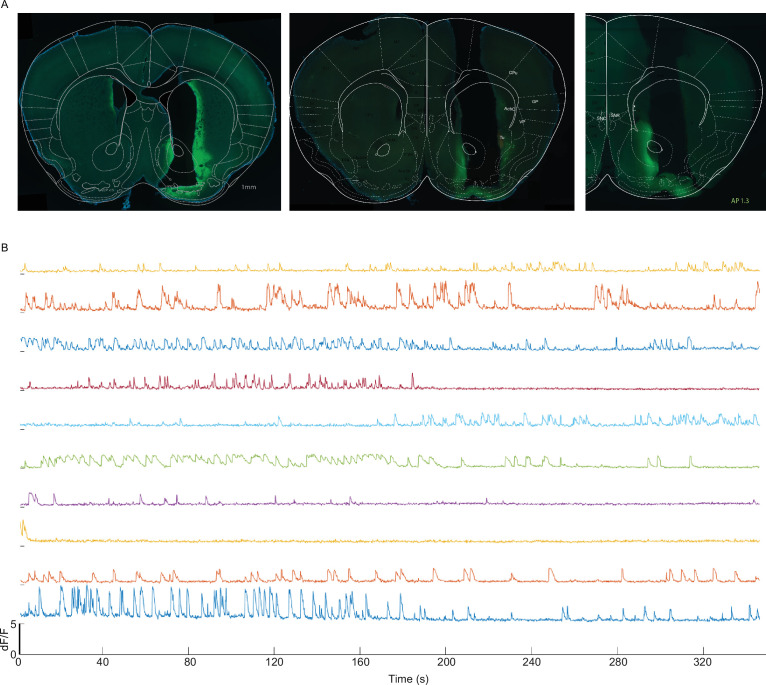
Figure 1—figure supplement 1. Two-photon imaging of calcium activity in Drd1-Cre and Adora2A-Cre transgenic mice.

Figure 1—figure supplement 1.

(A) 1 mm cannula targeting the olfactory tubercle (OT) in (left) Drd1-Cre mice injected with AAV9-Syn-FLEX-GCaMP7s and (middle and right) Adora2A-Cre mice injected with AAV9-Syn-FLEX-GCaMP7s. (B) Calcium transients recorded in 10 randomly selected D2 neurons.

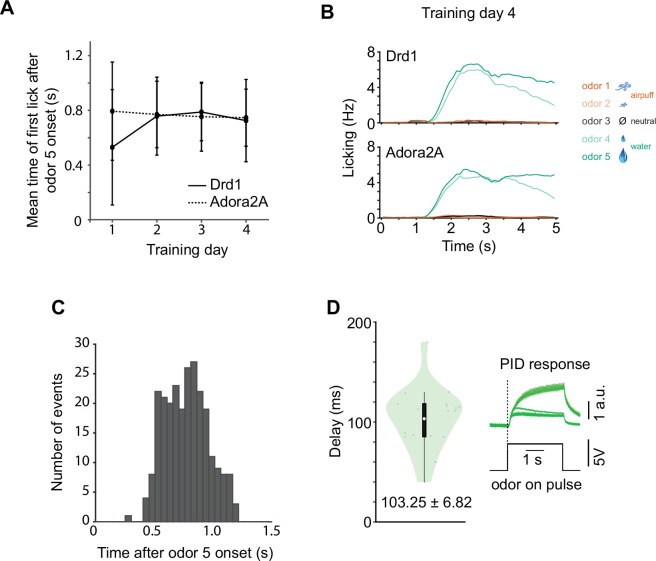
Figure 1—figure supplement 2. Anticipatory licking in trained mice.

Figure 1—figure supplement 2.

(A) The mean onset of the first lick to odor 5 (big reward predicting) during learning was similar for Drd1-Cre (n=6) and Adora2A-Cre (n=6) mice. (B) Time course of licking for all five odors in the same mice (day 4). (C) The full distribution of the times of first lick after odor onset of odor 5 (big reward predicting) in day 4 of training for both Drd1-Cre and Adora2A-Cre mice (m=360 trials in 12 mice). (D) The delay between the solenoid valve opening (which is denoted as time 0 throughout the manuscript) and the arrival of the odor at the mouse’s nostrils was measured with a miniPID instrument (Aurora Scientific, Inc), and was found to be reliably ~100 ms across trials and odors. For comparison, the time between successive imaging frames was 200 ms.

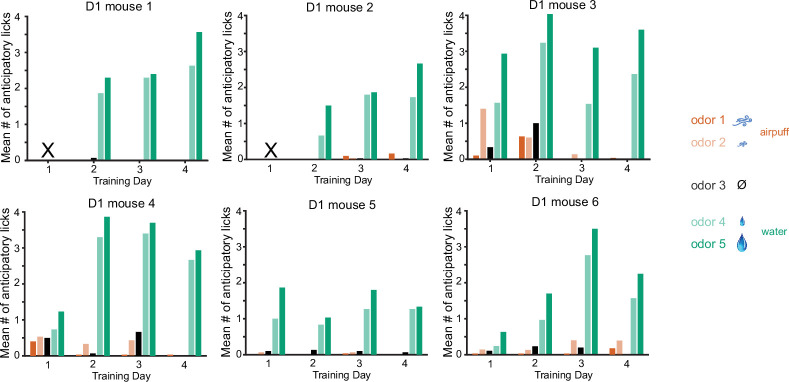
Figure 1—figure supplement 3. Anticipatory licking for each of the six Drd1-Cre mice.

Figure 1—figure supplement 3.

Licking to rewarded cues develops rapidly by day 2, and any licking to aversive cues on day 1 is suppressed in later days. The number of licks for the cue predicting larger reward (odor 5) is larger than that for the cue predicting smaller reward (odor 4).

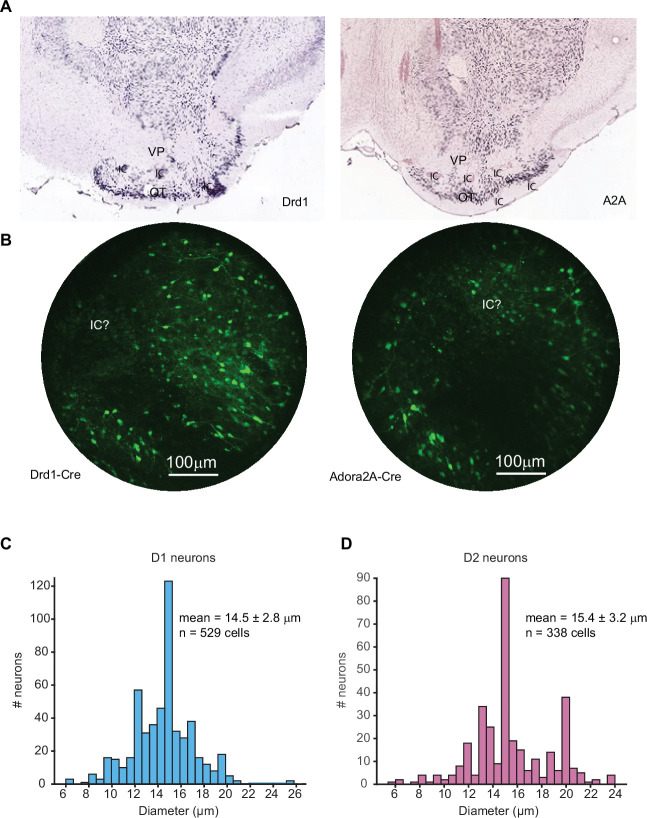
Figure 1—figure supplement 4. Cell size distributions for D1 and D2 neurons.

Figure 1—figure supplement 4.

(A) Panels reproduced from the Allen mouse atlas, showing expression of Drd1 and A2A in the olfactory tubercle (OT). (B) Sample fluorescence images from Drd1-Cre and Adora2A-Cre mouse brains imaged in vivo, with putative islands of calleja marked as ‘IC?’. (C, D) Distribution of soma sizes (measured from fluorescence images) for D1 and D2 neurons reveal very few neurons with sizes less than 10 μm.

Figure 1—figure supplement 5. Anticipatory licking of C57BL/6 WT mice with no craniotomy/Gradient-Index (GRIN) lens implant.
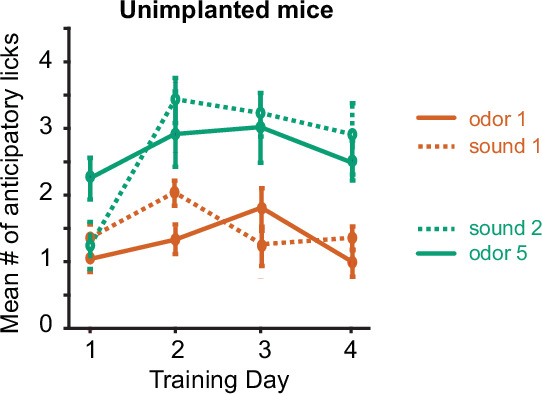
Figure 1—figure supplement 5.

Mice were trained in the odor-sound task with the same stimuli as the implanted mice, without prior training on the odor-odor task (n=13 mice). The odor-sound task is described in detail later in the paper.