. 2022 Jun 16;11:e70263. doi: 10.7554/eLife.70263

Figure 1. Temporally specific inactivation of multiple dorsal cortical regions during performance of a virtual reality-based evidence-accumulation task.

(A) Schematics of the experimental setup. (B) Psychometric functions for control trials, showing the probability of right-side choice as a function of the strength of right sensory evidence, ∆ towers (#R – #L). Thin gray lines: best fitting psychometric functions for each individual mouse (n=28). Black circles: aggregate data (n=108,940 trials), black line: fit to aggregate data, error bars: binomial confidence intervals. (C) Logistic regression curves for the weight of sensory evidence from four equally spaced bins on the final decision, from control trials. Thin gray lines: individual animals, thick black line: aggregate data, error bars: ± SD from 200 bootstrapping iterations. (D) Experimental design. We bilaterally inactivated seven dorsal cortical areas, alone or in combination, yielding a total of nine area sets, while mice performed the accumulating towers task. Bilateral inactivation happened during one of six regions in the maze spanning different parts of the cue region or delay. We thus tested a total of 54 area-epoch combinations. (E) Effects of sub-trial inactivation on overall performance during all 54 area-epoch combinations. Each panel shows inactivation-induced change in overall % correct performance for each inactivation epoch, for data pooled across mice. Error bars: SD across 10,000 bootstrapping iterations. Black circles indicate significance according to the captions on the leftmost panel. Light gray circles indicate data from individual mice (n=4–11, see Figure 1—source data 1 for details about n per condition).

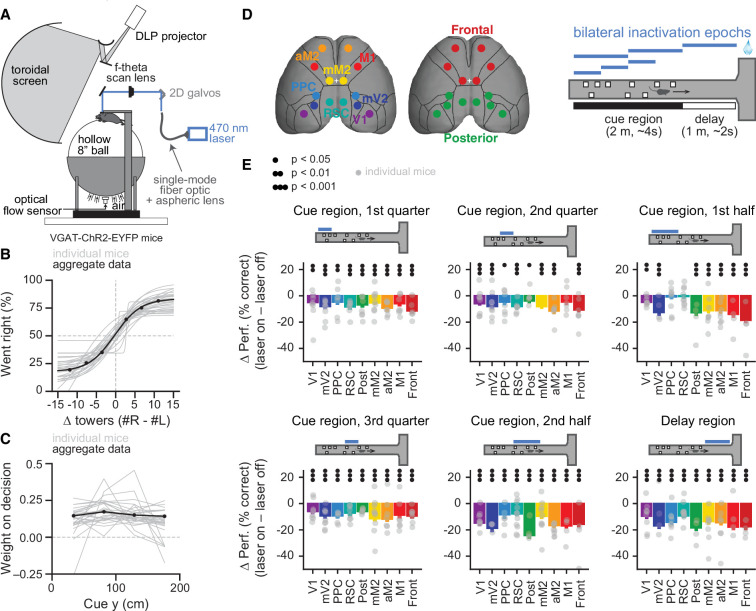
Figure 1—source data 1. Numbers of mice, sessions, and trials for each of the 54 experimental conditions.
Last line shows the number of unique mice and trials across all experiments, as conditions were partially overlapping for a given mouse and behavioral session.
Figure 1—source data 2. Source data for plots in Figure 1.

Figure 1.

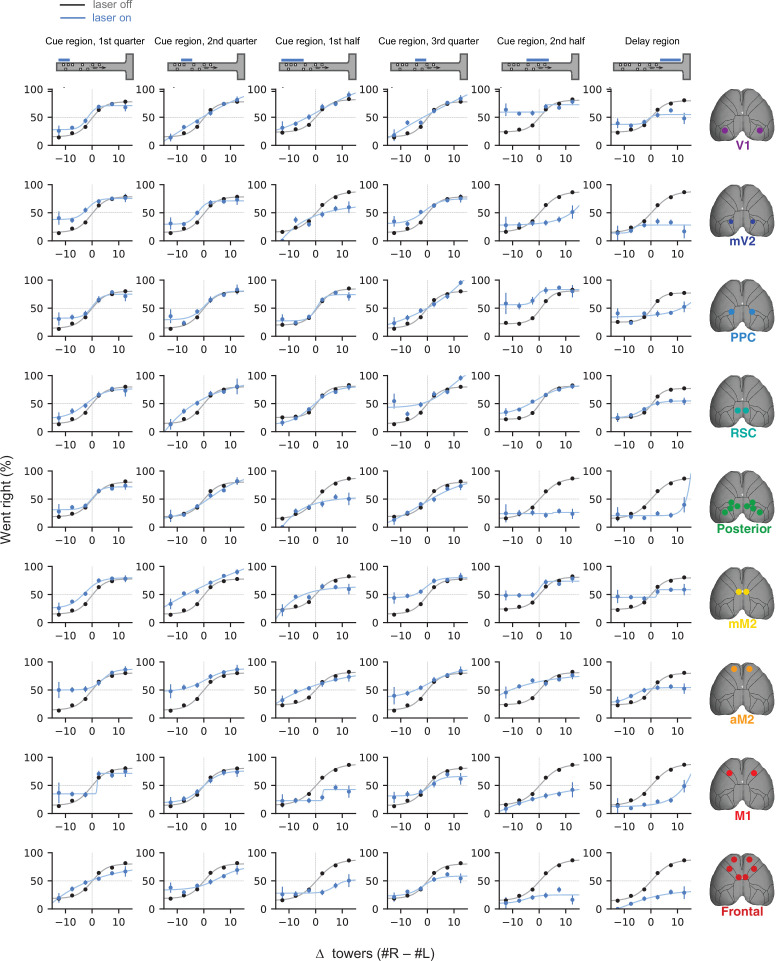
Figure 1—figure supplement 1. Effects of sub-trial inactivation on psychometric functions during all 54 area-epoch combinations.

Figure 1—figure supplement 1.

Black lines show control trials and blue lines show inactivation trials, for data pooled across mice. Error bars, binomial confidence intervals. Lines are best fitting psychometric functions.
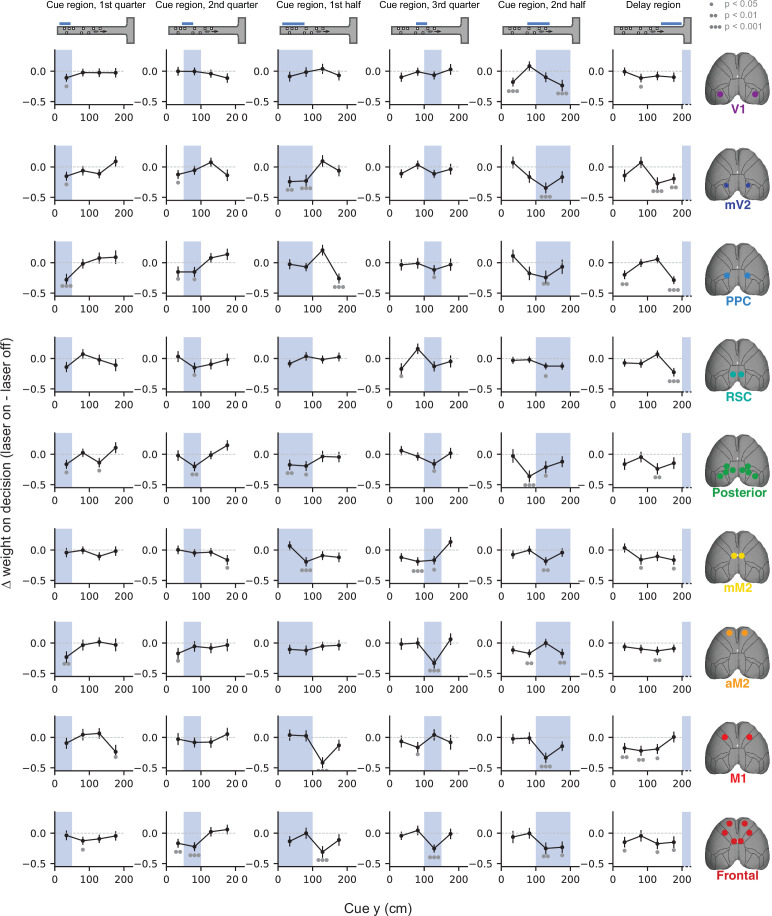
Figure 1—figure supplement 2. Effects of sub-trial inactivation on evidence-weighting functions during all 54 area-epoch combinations.

Figure 1—figure supplement 2.

Black lines show the inactivation-induced change in evidence weights (laser on – laser off), and shaded areas indicate inactivation epoch. Data were pooled across mice. Error bars, SD across 10,000 bootstrapping iterations. Gray circles indicate statistical significance according to the caption on top.
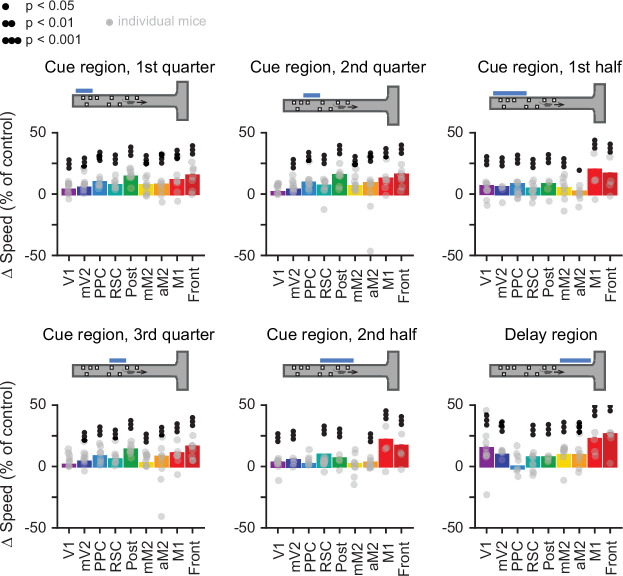
Figure 1—figure supplement 3. Inactivation of cortical areas moderately increases running speeds in some inactivation conditions.

Figure 1—figure supplement 3.

Effects of sub-trial inactivation on running speed during all 54 area-epoch combinations. Each panel shows inactivation-induced change in speed during the laser-on epoch or equivalent maze regions in control trials. Error bars: SD across 10,000 bootstrapping iterations, for data pooled across mice. Black circles indicate statistical significance according to the caption on top. Gray circles: individual mice.