. 2022 Jun 16;11:e70263. doi: 10.7554/eLife.70263

Figure 2. Inactivating different cortical areas leads to evidence-accumulation deficits on distinct timescales.

(A) Results from mixed-effects logistic regression models fit to inactivation data from different areas, combined across mice and inactivation epochs, with 10-fold cross-validation. For each area, we plot normalized evidence weights for inactivation trials, such that 0 means no difference from control, and –1 indicates complete lack of evidence weight on decision. Net evidence (#R – #L towers) was binned in time (0.5 s time bins) and aligned to either laser onset or offset. Coefficients were extracted from the model with highest cross-validated accuracy. Thin gray lines and crosses, mouse random effects (primary visual cortex [V1]: n=15, medial secondary visual cortex [mV2]: n=14, posterior parietal cortex [PPC]: n=20, retrosplenial cortex [RSC]: n=21, posteromedial portion of the premotor cortex [mM2]: n=15, anterior portion of the premotor cortex [aM2]: n=15, primary motor cortex [M1]: n=11; note that we omitted 10/666 random effect outliers outside the 1st–99th percentile range for clarity, but they were still considered in the analysis). The zero-mean random effects were added to the fixed effects for display only. Error bars, ± SEM on coefficient estimates. Black circles below the data points indicate statistical significance from t-tests, with false discovery rate correction. We also imposed an additional significance constraint that the coefficient ± SEM does not overlap with ± SD intervals for coefficients for models fit to shuffled data (gray shaded areas, see Materials and methods for details). (B) Distribution of model prediction accuracy, defined as the proportion of correctly predicted choices in 10% of the data not used to fit the model (n=9 areas × 10 cross-validation runs). (C) Comparison of the inactivation effects between areas in the posterior (V1, mV2, PPC, RSC) and frontal cortex (mM2, aM2, M1). Thin lines with crosses, individual areas. Thick lines and error bars, mean ± SEM across areas. p-values are from a two-way ANOVA with repeated measures, with time bins and area group as factors.

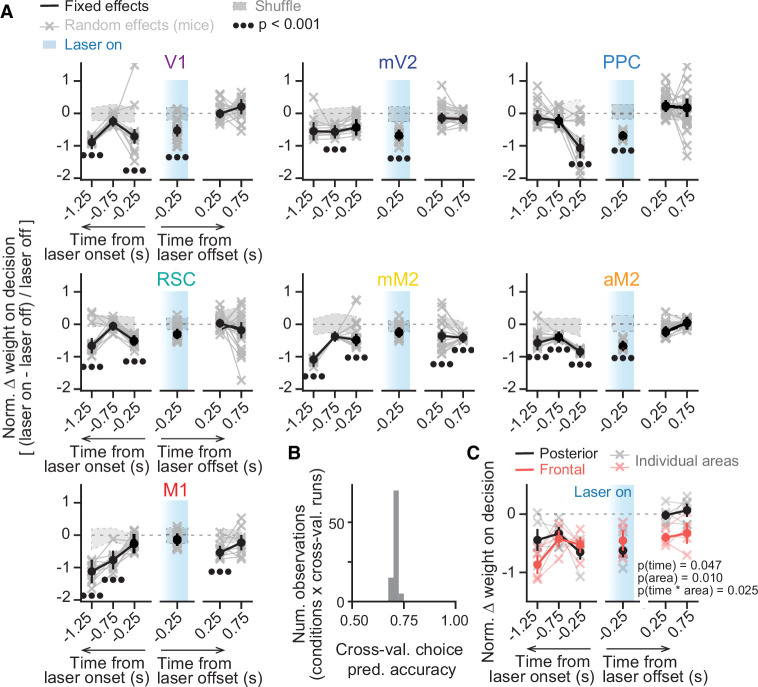
Figure 2—source data 1. Source data for plots in Figure 2.

Figure 2.

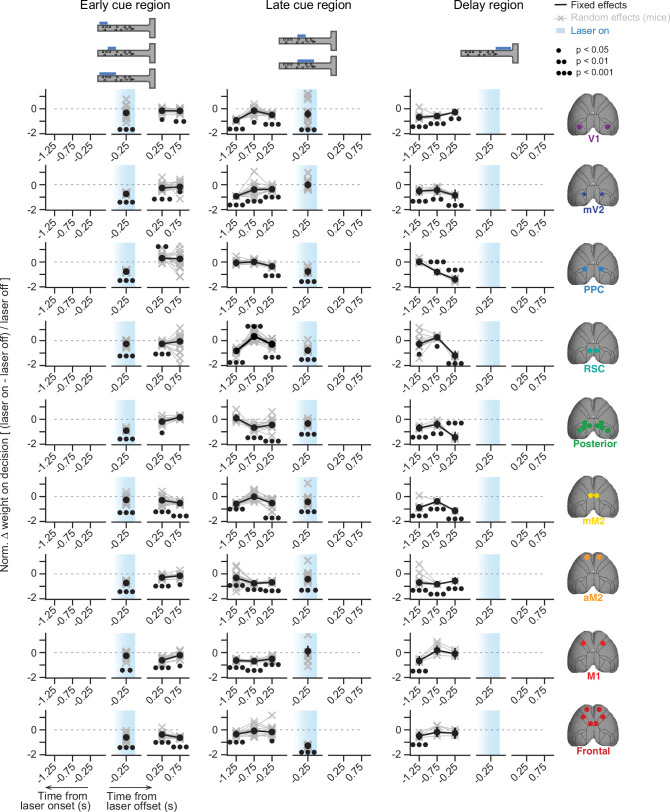
Figure 2—figure supplement 1. Effects of inactivation on sensory-evidence weights across trial time appear to depend on when the inactivation occurred, for a subset of areas.

Figure 2—figure supplement 1.

Results from mixed-effects logistic regression models fit to inactivation data from different areas (rows), combined across mice and subsets of inactivation epochs (columns, captions on top), with 10-fold cross-validation. For each area, we plot normalized evidence weights for inactivation trials, such that 0 means no difference from control, and –1 indicates complete lack of evidence weight on decision. Net evidence (#R – #L towers) was binned in time (0.5 s time bins) and aligned to either laser onset or offset. Coefficients were extracted from the model run with highest cross-validated accuracy. Thin gray lines and crosses, mouse random effects (note that we omitted random effect outliers outside the 1st – 99th percentile range for clarity, but they were still considered in the analysis). Error bars, ± SEM on coefficient estimates. Black circles below the data points indicate statistical significance from t-tests, with false discovery rate correction. V1, primary visual cortex; mV2, medial secondary visual cortex; PPC, posterior parietal cortex; RSC, retrosplenial cortex; mM2, posteromedial portion of the premotor cortex; aM2, anterior portion of the premotor cortex; M1, primary motor cortex.
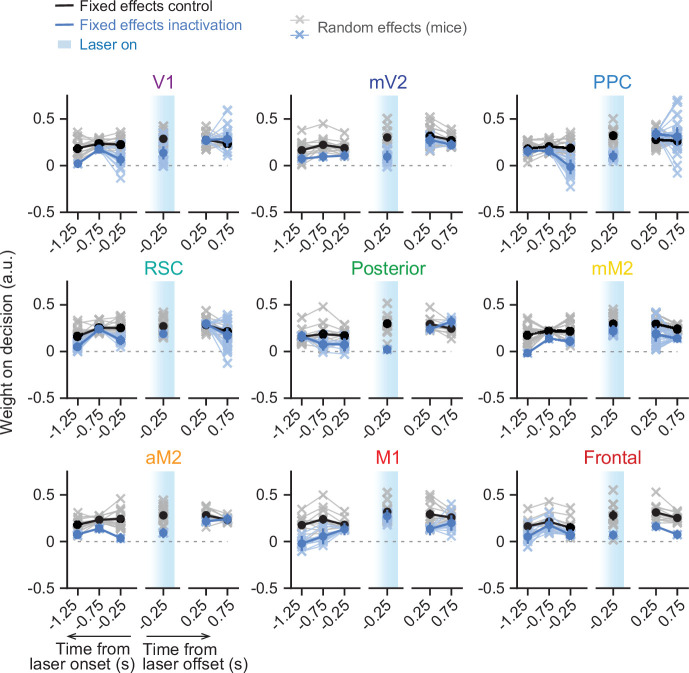
Figure 2—figure supplement 2. Sensory-evidence weights across trial time plotted separately for control and laser trials.

Figure 2—figure supplement 2.

Results from mixed-effects logistic regression models fit to inactivation data from different areas, combined across mice and inactivation epochs, with 10-fold cross-validation. For each area, we plot evidence weights for control (black) and inactivation trials (blue). Net evidence (#R – #L towers) was binned in time (0.5 s time bins) and aligned to either laser onset or offset. Coefficients were extracted from the model run with highest cross-validated accuracy. Thin gray lines and crosses, mouse random effects (primary visual cortex [V1]: n=15, medial secondary visual cortex [mV2]: n=14, posterior parietal cortex [PPC]: n=20, retrosplenial cortex [RSC]: n=21, posterior, n=11, posteromedial portion of the premotor cortex [mM2]: n=15, anterior portion of the premotor cortex [aM2]: n=15, primary motor cortex [M1]: n=11, frontal, n=11). Error bars, ± SEM on coefficient estimates.