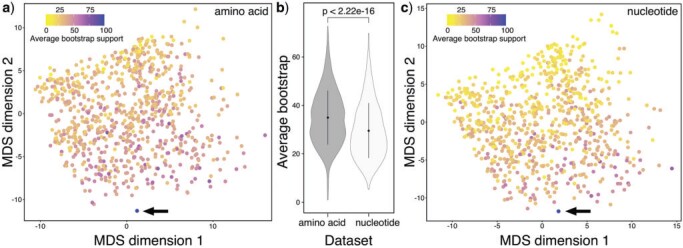
Figure 2.
Multidimensional Scaling (MDS) of the pairwise Robinson-Foulds phylogenetic distance among all the amino acid (a) and nucleotide gene trees (c). Each dot represents a gene tree and is colored based on the average bootstrap support calculated among all nodes in its topology. In the pairwise comparisons, the relative data set (species tree) is included as a blue dot indicated by a black arrow, obtained using RAxML-NG from the concatenated partitioned matrices. Average bootstrap values of both data sets are shown in (b) where the black dots inside the violin plots represent the mean values (for the amino acid and nucleotide data sets), while the black whiskers indicate the standard deviations.

