Fig. 2.
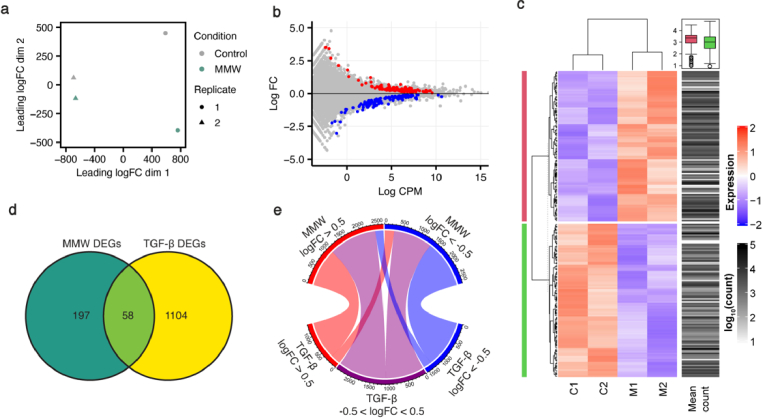
MMWs cause unique transcriptomic modifications. (a) Principal component analysis (PCA) of RNA-seq data from untreated (control) and MMW-exposed primary human fibroblasts. Dots represent samples, with condition indicated by colour and biological replicate by shape. (b) MD plot reveals the log fold change and average abundance of each gene, with significantly differentially expressed (FDR < 0.05) genes shown in red (upregulated) and blue (downregulated). (c) Heatmap showing relative expression and abundance of the top 200 differentially expressed genes. Colour corresponds to the relative expression levels, while the intensity of the mean count column indicates the average abundance of the gene. The mean counts of MMW up- and down- regulated genes are shown by pink and green groupings in the boxplot. (d) Venn diagram of differentially expressed genes (DEGs) by MMW exposure and transforming growth factor beta (TGF-β) treatment. 58 genes are differentially expressed by MMWs and TGF-β. (e) Chord diagram of all genes with |log2FC| > 0.5 in expression following 2 d MMW exposure. Genes are compared with their expression level in TGF-β treated cells, with log2FC > 0.5 in red, log2FC < −0.5 in blue and −0.5 < log2FC < 0.5 in grey.

