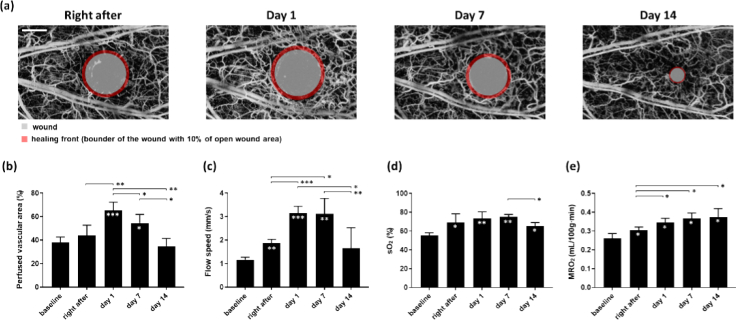
Fig. 4.
(a) Illustration of wound healing process and the definition of the healing front. (b-e) Changes in perfused vascular area, flow speed, sO2, and MRO2 in the wound healing front. White asterisks within the bars indicate the p values between the baseline and the specific time point. Paired t-test was used for all comparisons. *, **, ***, and **** represent p < 0.05, p < 0.01, p < 0.001, and p < 0.0001, respectively. Data are presented as mean ± SD. Scale bar: 500 µm. n = 4.

