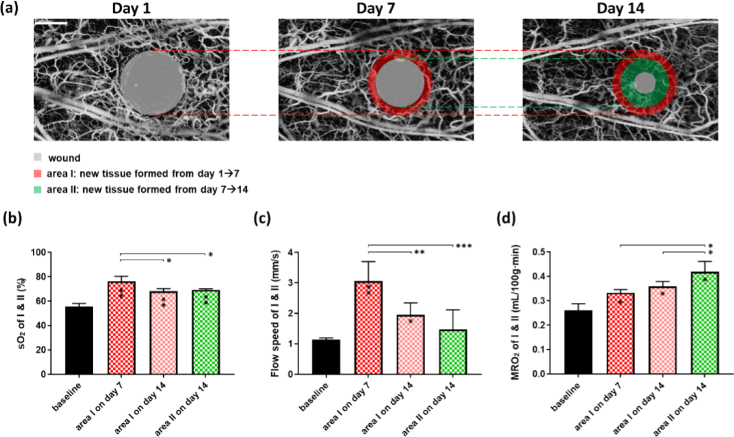
Fig. 5.
(a) Illustration of the newly formed tissues. (b-d) Changes in sO2, flow speed, and MRO2 of the newly formed tissues during the wound healing process. Paired t-test was used for all comparisons. *, **, ***, and **** represent p < 0.05, p < 0.01, p < 0.001, and p < 0.0001, respectively. Data are presented as mean ± SD. Scale bar: 500 µm. n = 4.

