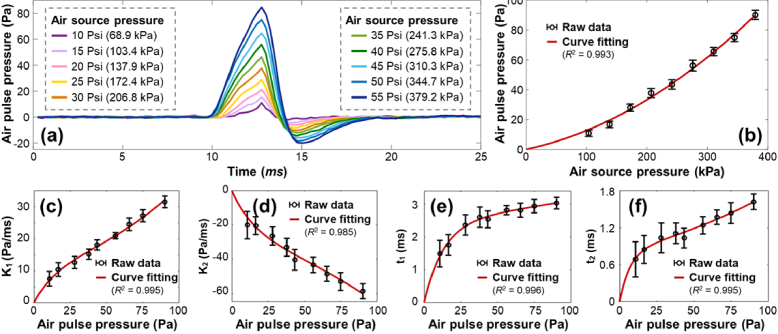
Fig. 6.
The measured and calibrated air-pulse profiles (n = 50 repeated measurements for each pressure). (a) The measured air-pulse profiles in the time domain. The input air source pressures were controlled in the range of 10–55 Psi (color series). Each profile is the average value of 50 measurements. (b) The relation between the output air-pulse pressure and the input air-pulse pressure was fit by a second-order polynomial curve. Panels (c–f) show the calibrated air-pulse parameters (k1, k2, t1, t2) in relation to the air-pulse pressures, where k1 and k2 are the slops, and t1 and t2 are the time durations of the air-pulse profile. The relations between the air-pulse parameters (k1, k2, t1, t2) and the air-pulse pressures were fit to second-order exponential curves based on Eq. (6).

