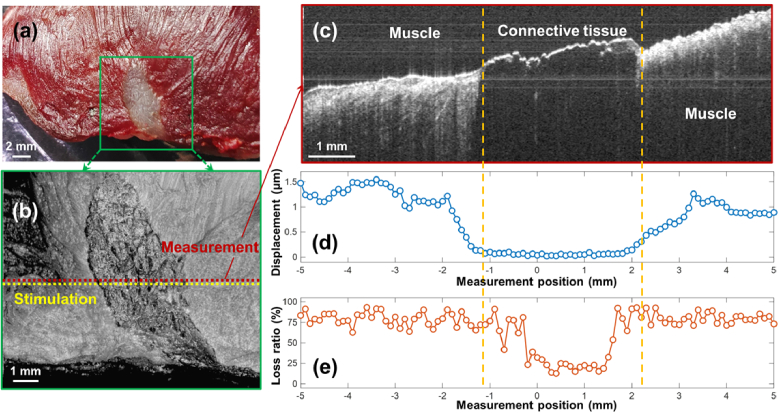
Fig. 11.
Assessment of tissue hysteresis for a beef shank sample. (a) Top view photo of a beef shank sample. The window shows the region (10×10 mm2) for the optical coherence tomography (OCT) structural imaging, which includes a mixture of connective tissue centered between muscle fibers on both sides. (b) En face OCT imaging. (c) Cross-sectional OCT imaging for the measured positions. (d) and (e) are the displacement and hysteresis loss ratio values along the measurement portions (total 101 points in 10 mm length).

