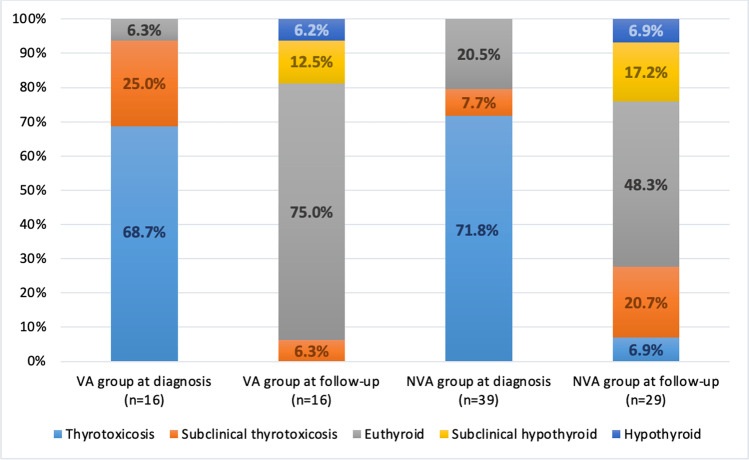
Fig. 2.
Thyroid hormone status of the vaccine-associated (VA) and non-vaccine associated (NVA) subacute thyroiditis (SAT) patient groups at the time of diagnosis (n = 55) and at follow-up (n = 45) is shown in the graph. The frequency of euthyroidism during the follow-up of VA SAT cases appears similar to that of the NVA group. VA vaccine-associated group, NVA non-vaccine associated group

