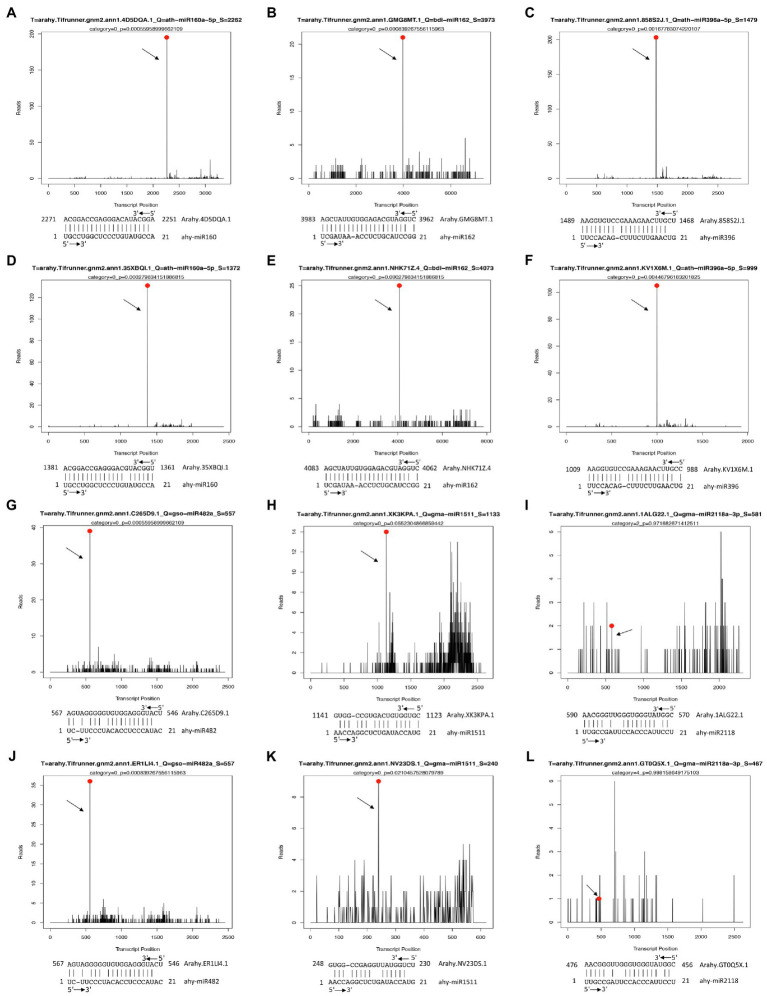
Figure 4.
Examples of T-plots of miRNA targets in two peanut RILs confirmed by degradome sequencing. The T-plots show the distribution of the degradome tags along the full length of the target mRNA sequence. The vertical red line indicates the cleavage site of each transcript and is also shown by an arrow. (A,D) The cleavage features in AhARF10 (Arahy.4D5DQA.1) and ARF17 (Arahy.35XBQI.1) mRNA by ahy-miR160 in DS1. (B,E) The cleavage features in AhDCL6 (Arahy.GMG8MT.1) and AhDCL16 (Arahy.NHK71Z.4) mRNA by ahy-miR162 in DS1. (C,F) The cleavage features in AhGRF1 (Arahy.858S2J.1) and AhGRF4 (Arahy.KV1X6M.1) mRNA by ahy-miR396 in DS1. (G,J) The cleavage features in AhWDRL1 (Arahy.C265D9.1) and AhWDRL2 (Arahy.ER1LI4.1) mRNA by ahy-miR482 in DS1. (H,K) The cleavage features in AhSRF (Arahy.XK3KPA.1) and AhSP1L1 (Arahy.NV23DS.1) mRNA by ahy-miR1511 in DS1. (I,L) The cleavage features in AhDR1 (Arahy.1ALG22.1) and AhDR2 (Arahy.GT0Q5X.1) mRNA by ahy-miR2118 in DS1.

